")
[ad_1]
Bitcoin’s price has been confided by a very tight price range between the 50-day moving average and the ascending trendline. Considering the importance of this price range, the breakout’s direction should determine the mid-term perspective of the cryptocurrency’s path.
technical analysis
By Shayan
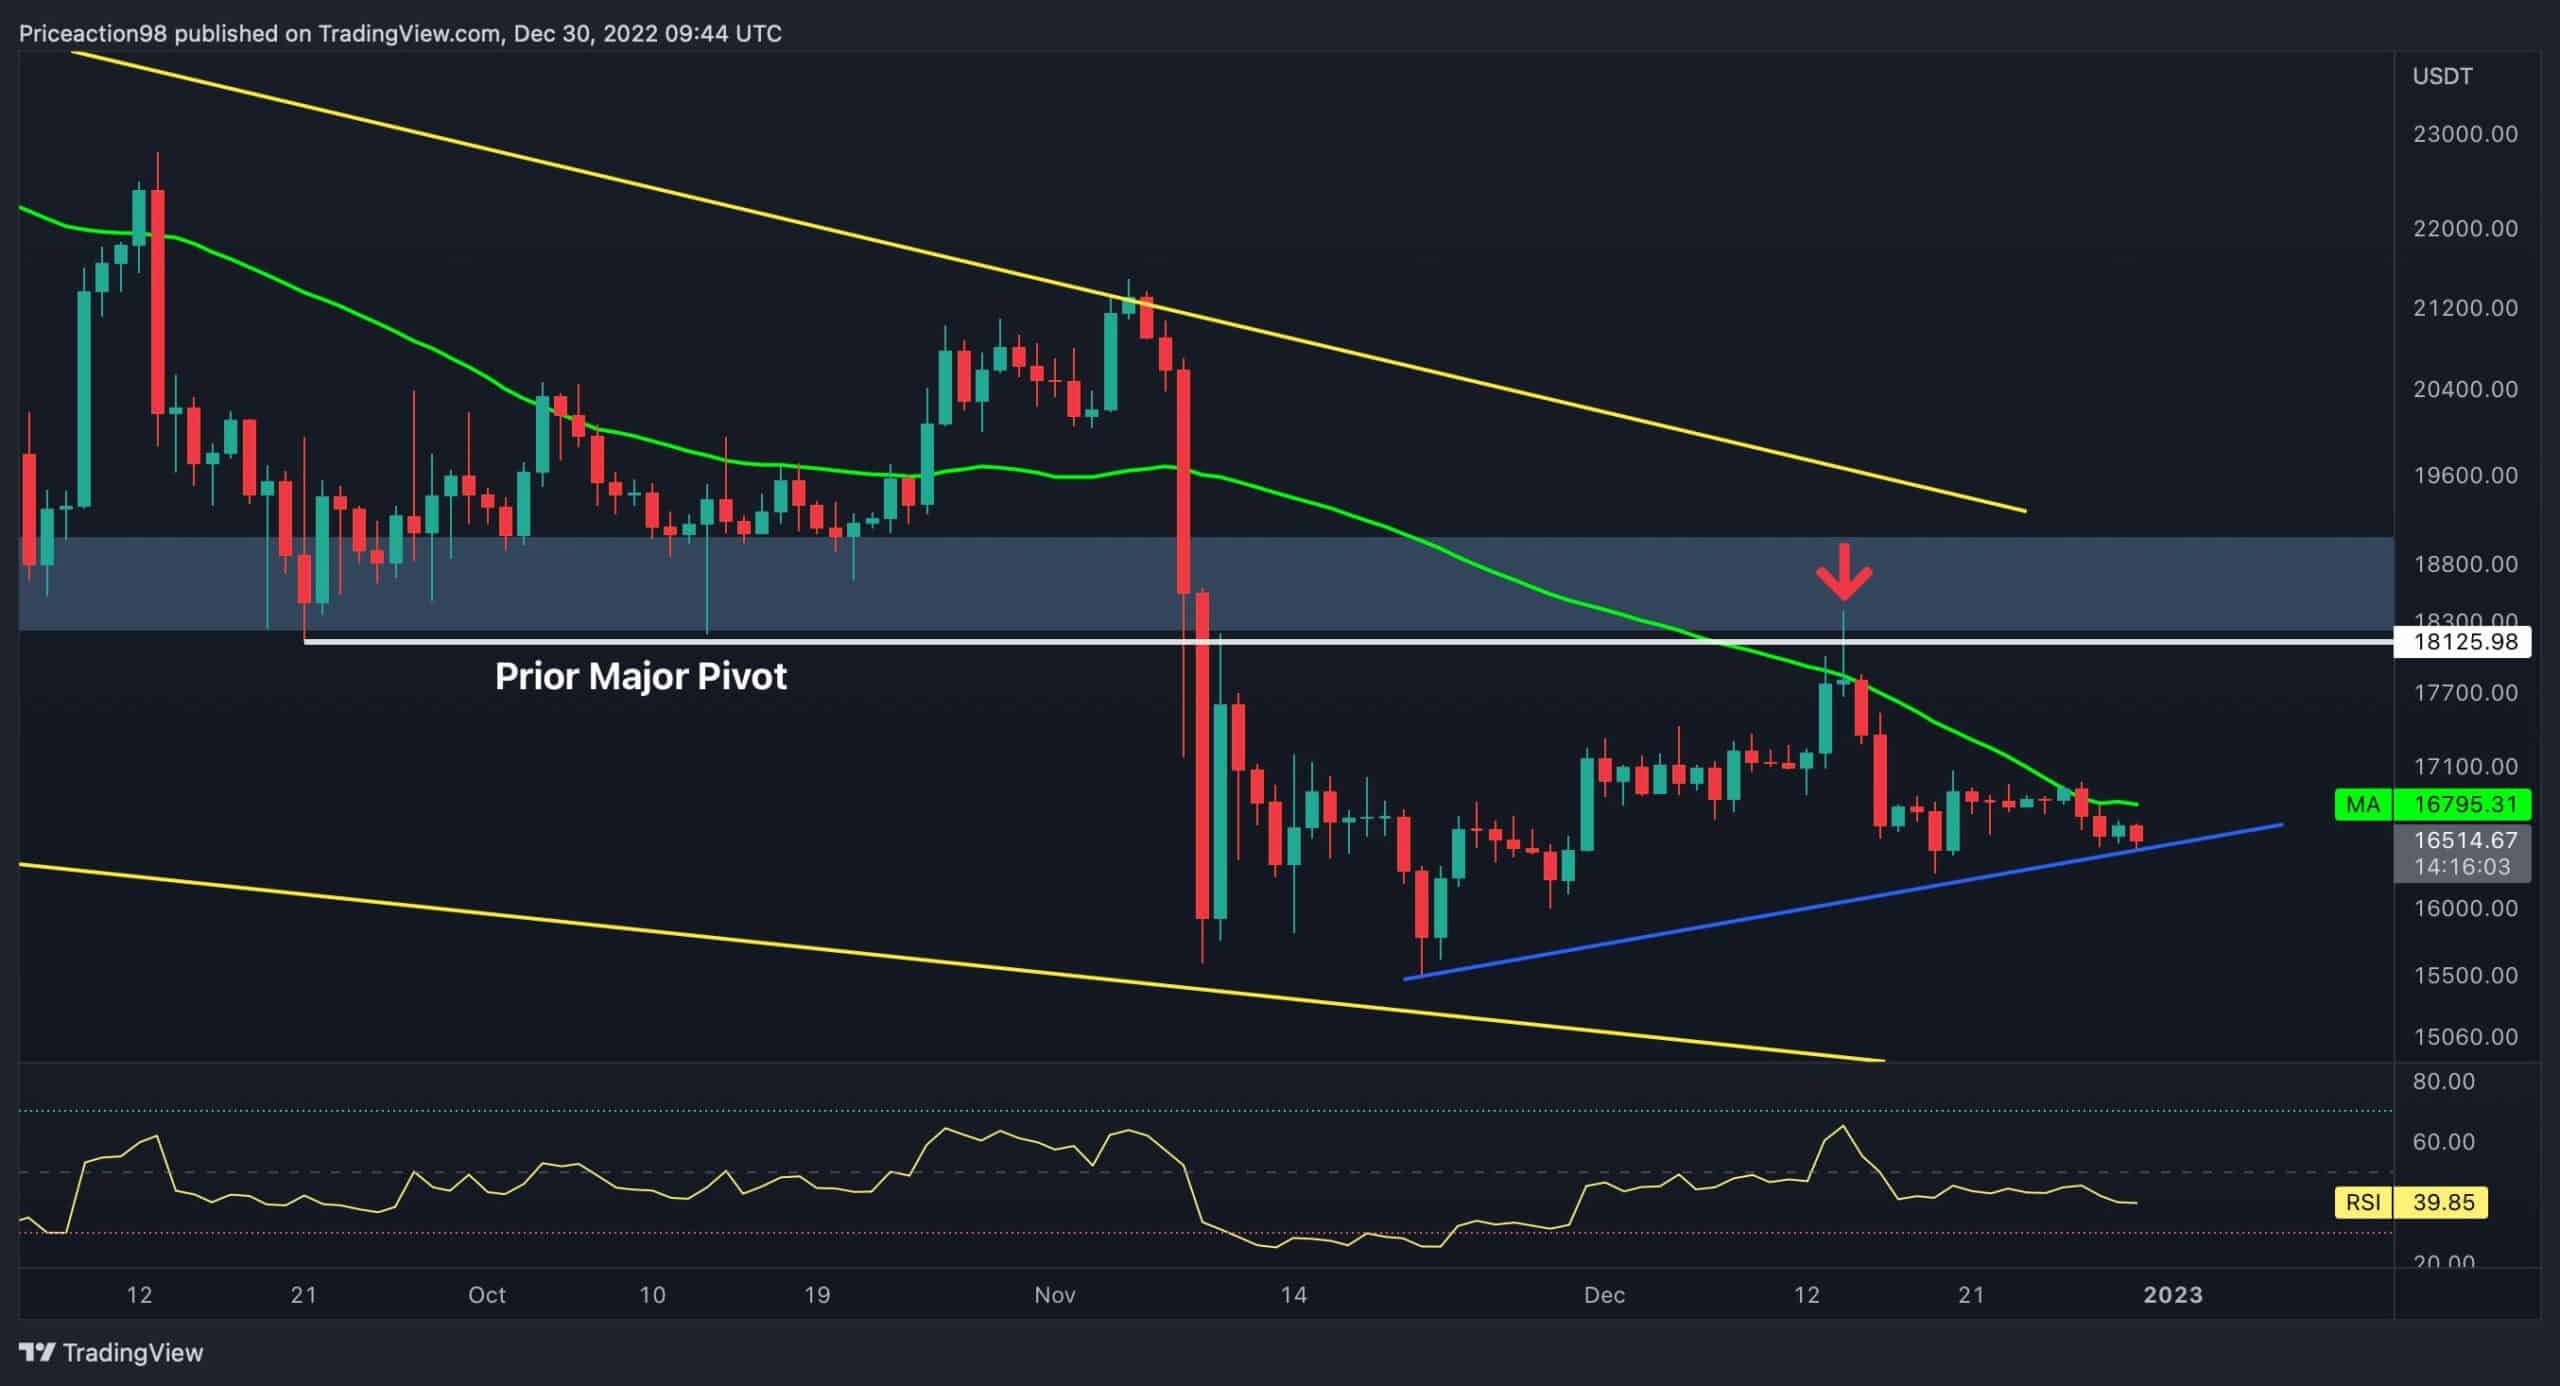
The Daily Chart
Bitcoin’s price started recovering after the significant crash towards $15K in mid-November. However, the rally didn’t last long and was halted at the $18K resistance level.
On the other hand, the $18K resistance level aligns with Bitcoin’s prior major pivot. In the classical price action analysis, major pivots are crucial in serving as resistance or support for the price based on the trend’s direction. A failure to surpass the prior main pivot in an uptrend rally is a clear bearish sign.
As the chart shows, Bitcoin’s uptrend rally stopped at the same level as the prior major pivot at $18.3K. In light of this, the price has initiated another bearish rally. Hence, considering the current market structure and price action, a drop below the blue trendline seems more likely.
The 4-Hour Chart
After getting rejected at $18.3K, the price reversed and started an impulsive bearish rally. Short-term continuation correction phases always accompany an impulsive rally.
In the 4-hour timeframe, after a steep drop, the price entered a short-term continuation consolidation stage and formed an ascending bearish wedge pattern.
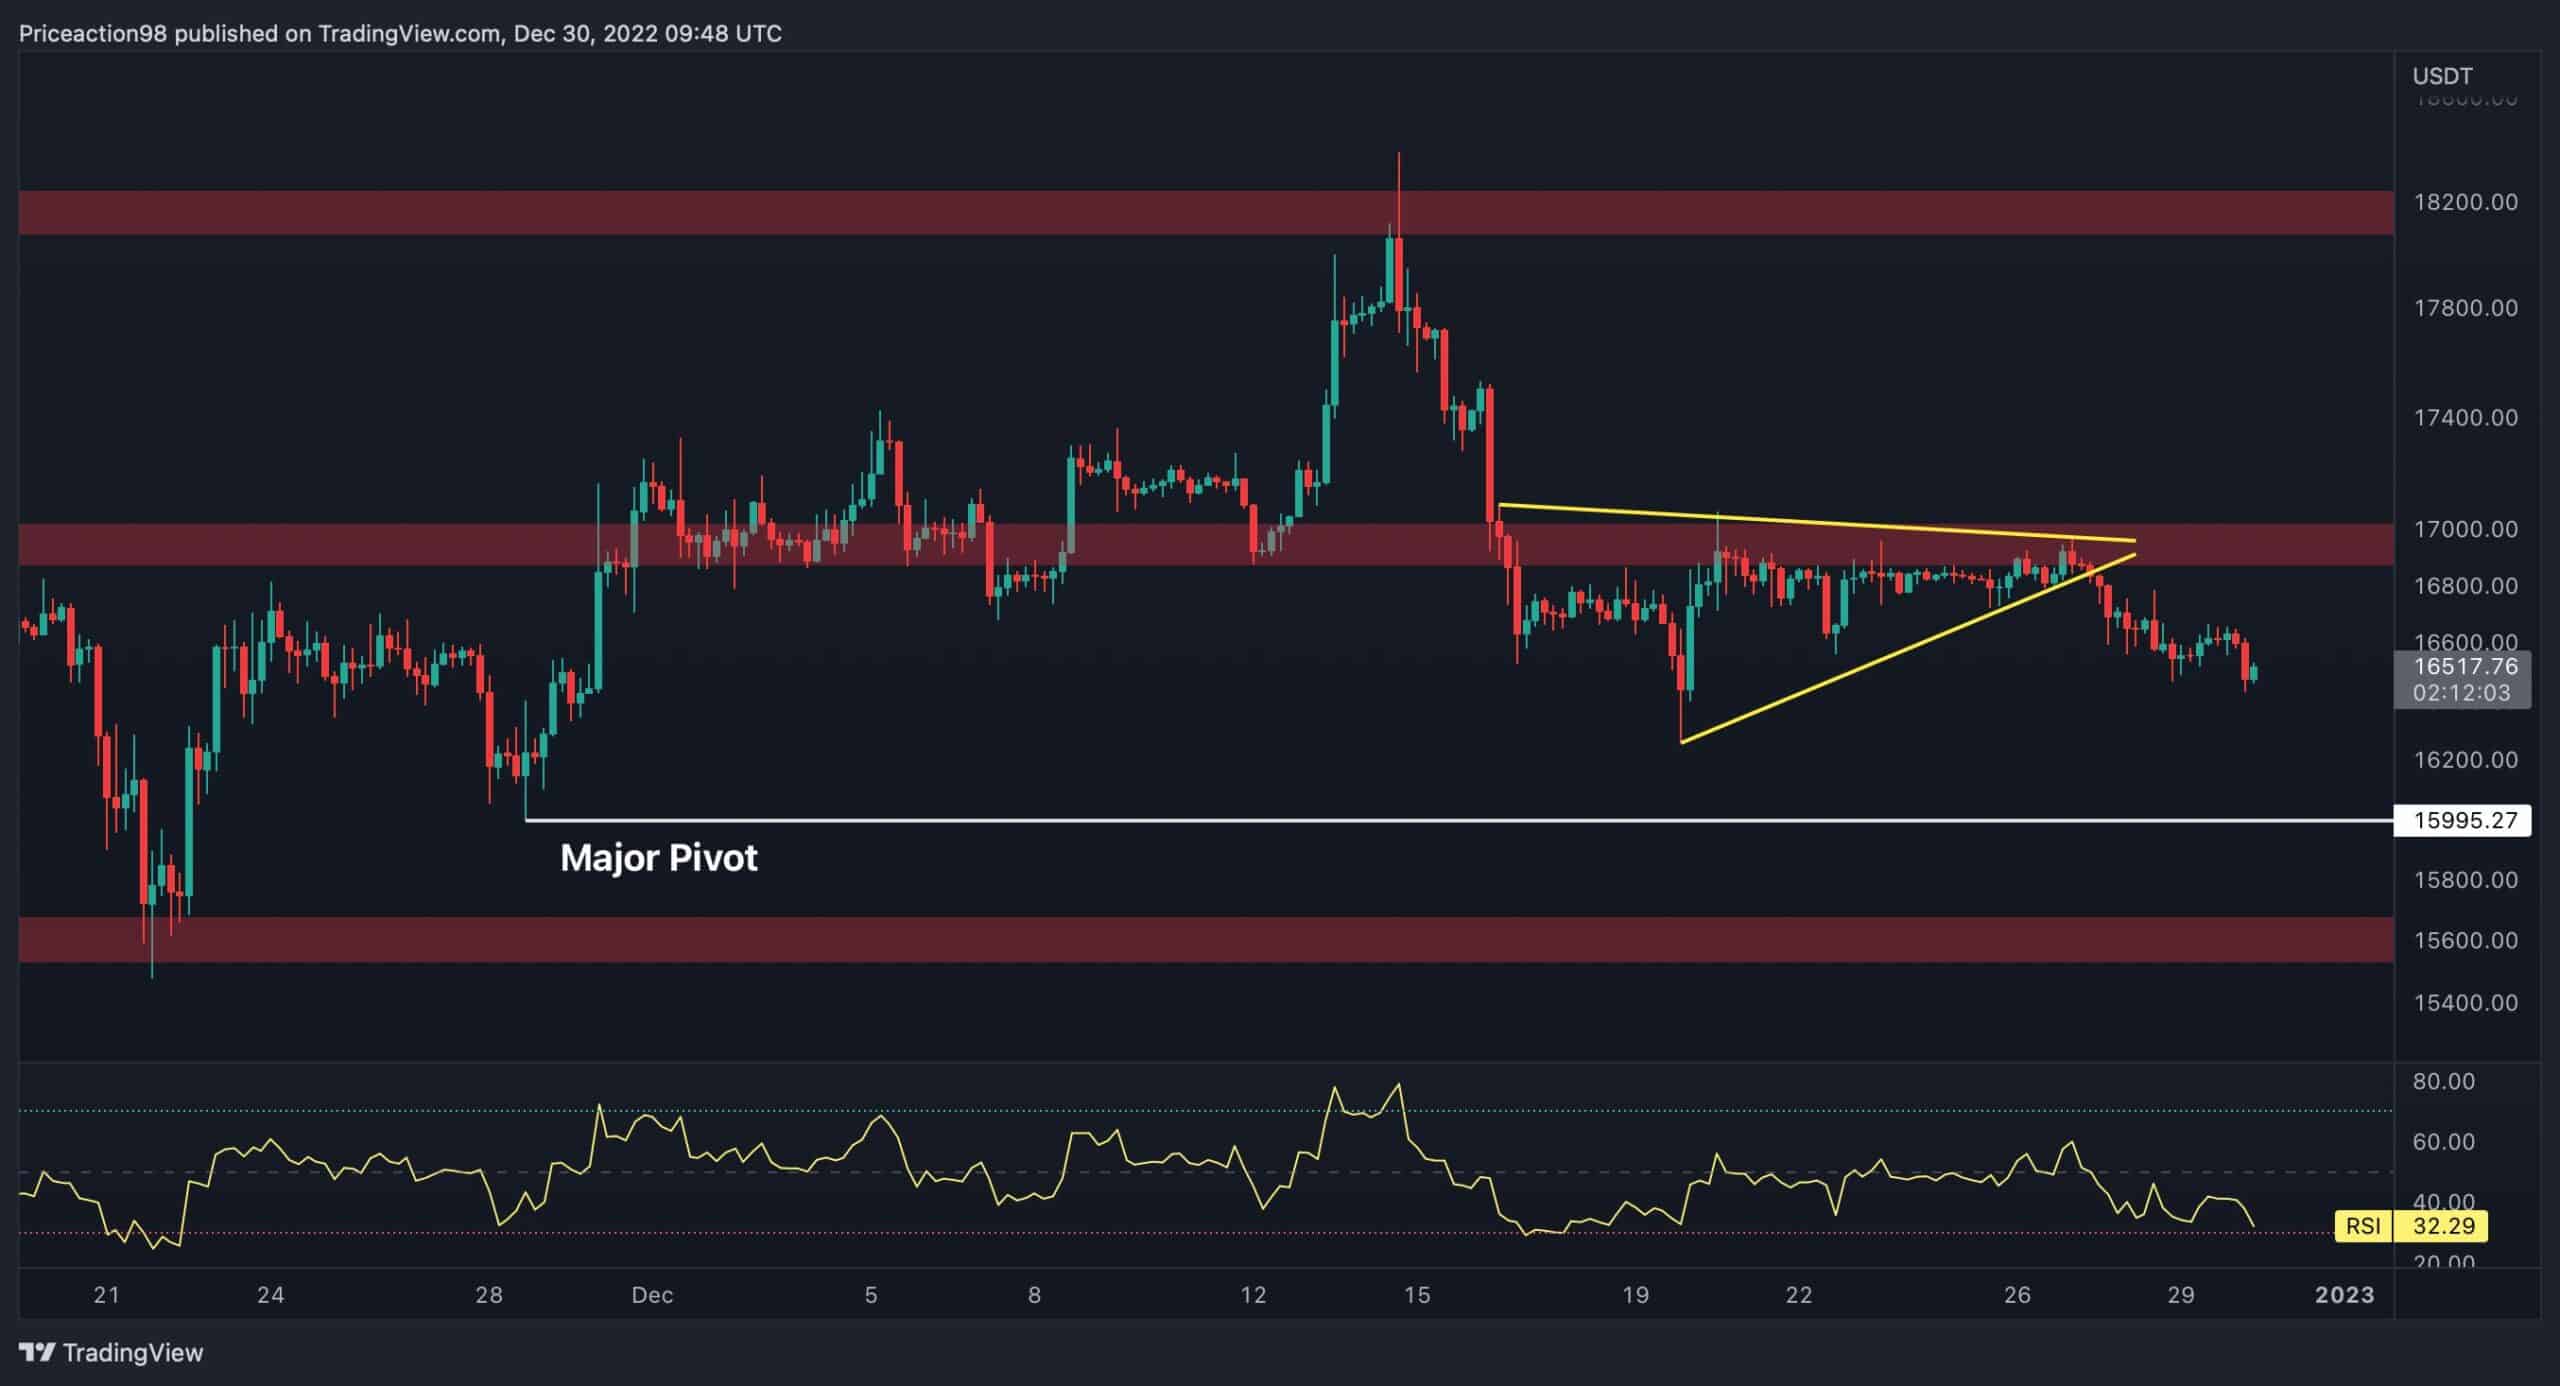
Most recently, the price plummeted below the lower boundary, which validated the continuation of the bearish trend and continued to plunge towards the next support level. The following critical support level is the prior major pivot at $15.9K. If it fails, market players should anticipate another price crash towards $15.4K, the recent cycle’s low.
On-Chain Analysis
By CryptoVizArt
Demand Momentum Active Addresses
This indicator tracks the ratio of the monthly average to the yearly average of “Active Addresses” in the Bitcoin Network.
The ratio between the short-term moving average and long-term moving average mimics the new demand joining/leaving the network.
- 30 DMA > 356 DMA: in the early stages of a bull market, the monthly averaged indicator breaks above the yearly averaged line, denoting a solid wave of demand for utilizing the Bitcoin network
- 30 DMA < 356 DMA: Oppositely, after realizing the primary signs of a bear market, the shorter moving average of the active address tends to plunge below the longer moving average. This pattern indicates the entities, mostly speculators, leaving the network due to the negative sentiment they foresee in the mid to long term.
Revisiting the 2022 trend of this metric shows that since December 2021, the market began a range of diminishing demand across the network. The declining rate in this metric has been slowing down since the early Jun market capitulation.
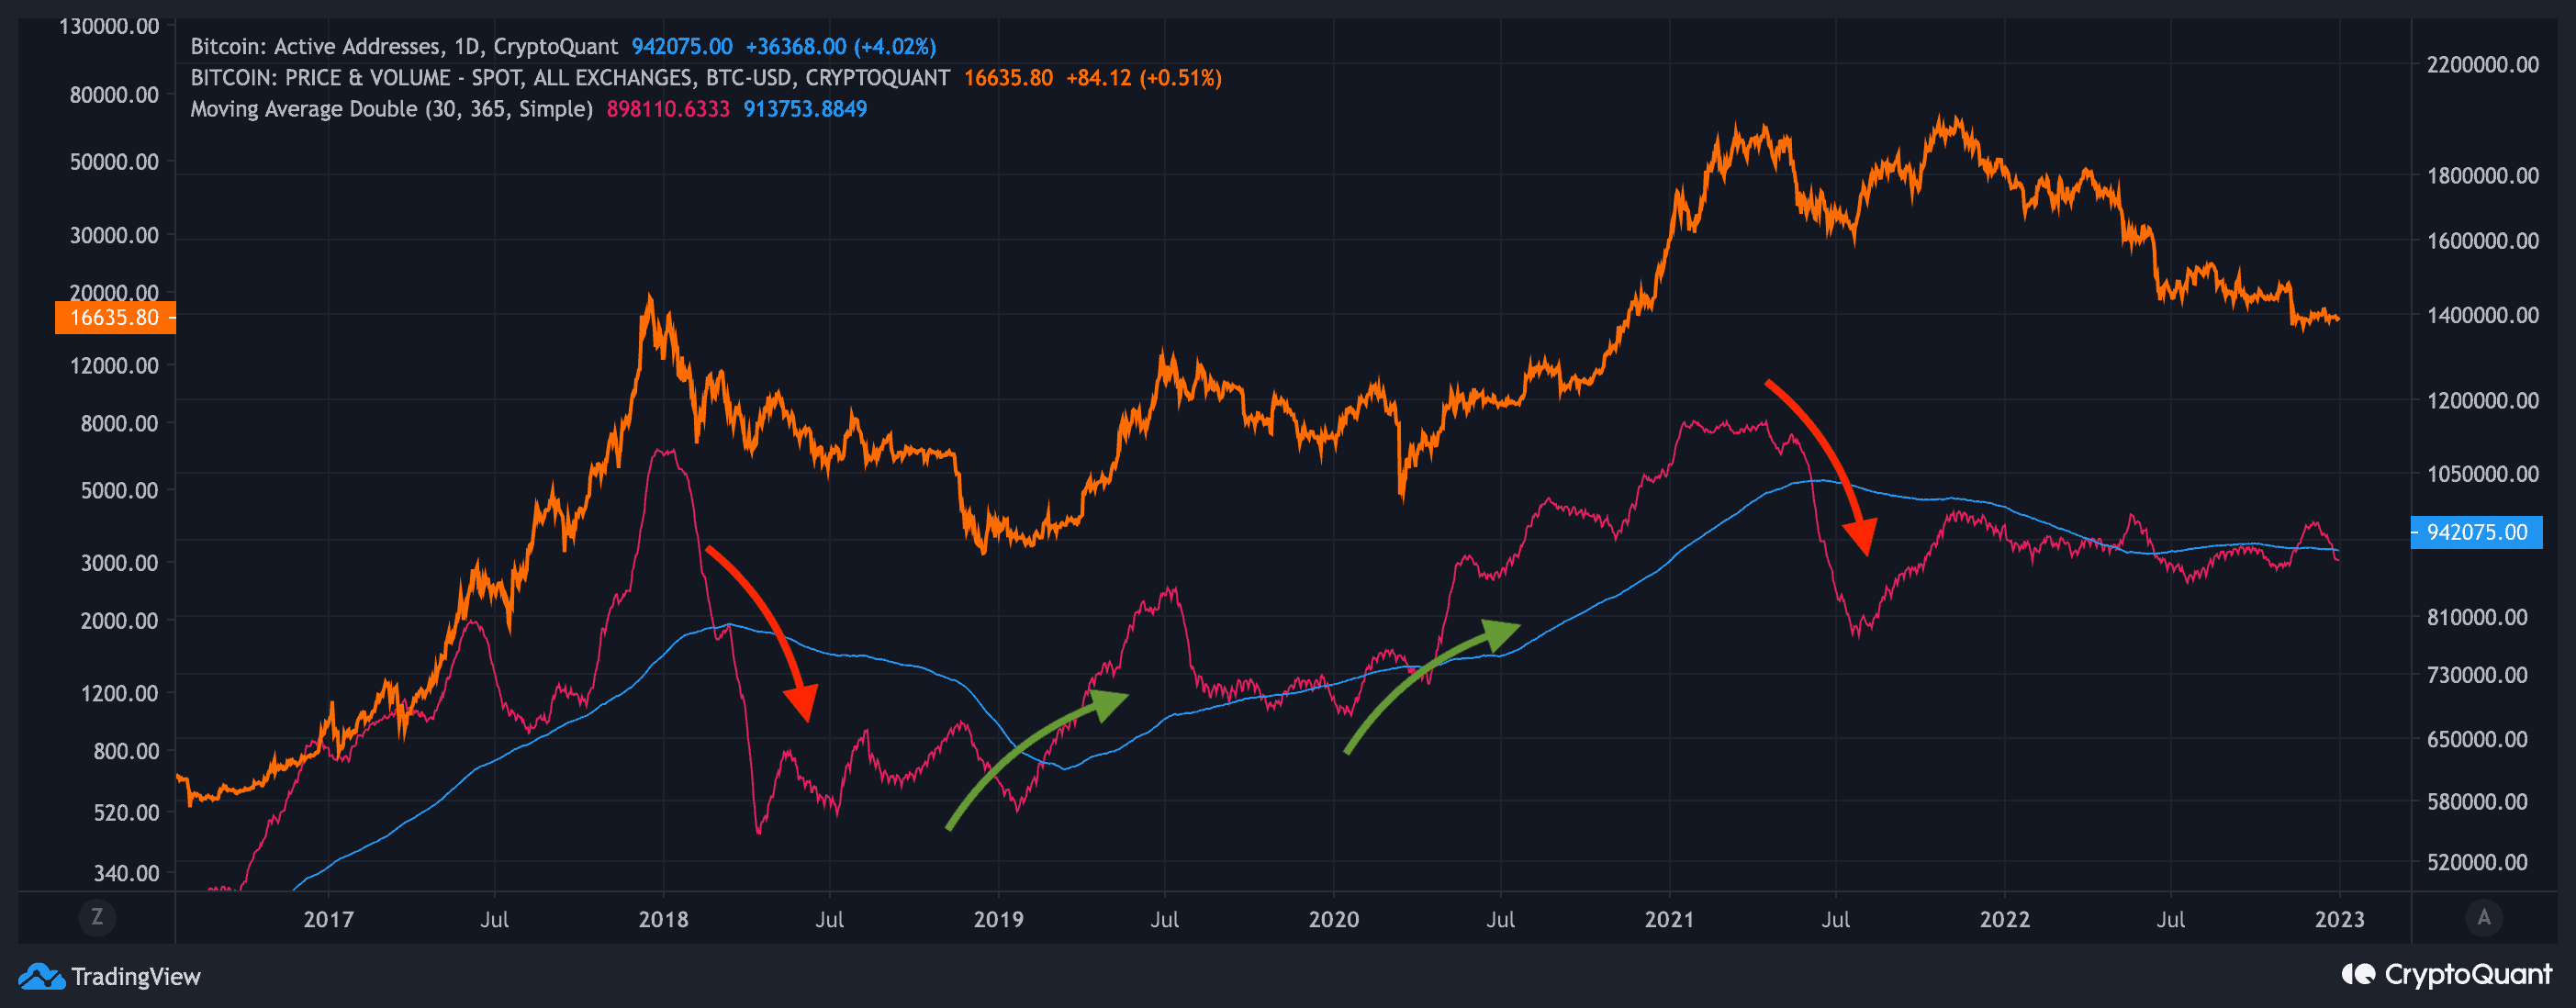
Presently, we are witnessing a fragile equilibrium status in the active address momentum, creating a potential for a possible rally if new demand enters the market in the coming weeks.
Binance Free $100 (Exclusive): Use this link to register and receive $100 free and 10% off fees on Binance Futures first month (terms).
PrimeXBT Special Offer: Use this link to register & enter POTATO50 code to receive up to $7,000 on your deposits.
Disclaimer: Information found on CryptoPotato is those of writers quoted. It does not represent the opinions of CryptoPotato on whether to buy, sell, or hold any investments. You are advised to conduct your own research before making investment any decisions. Use provided information at your own risk. See Disclaimer for more information.
Cryptocurrency charts by TradingView.
[ad_2]
Source link