")
[ad_1]
Bitcoin’s price rally has come to a halt as the market has been consolidating below a significant resistance level for weeks. While there are some worrying technical signs in the short term, a very bullish signal is also developing.
technical analysis
By: Edris
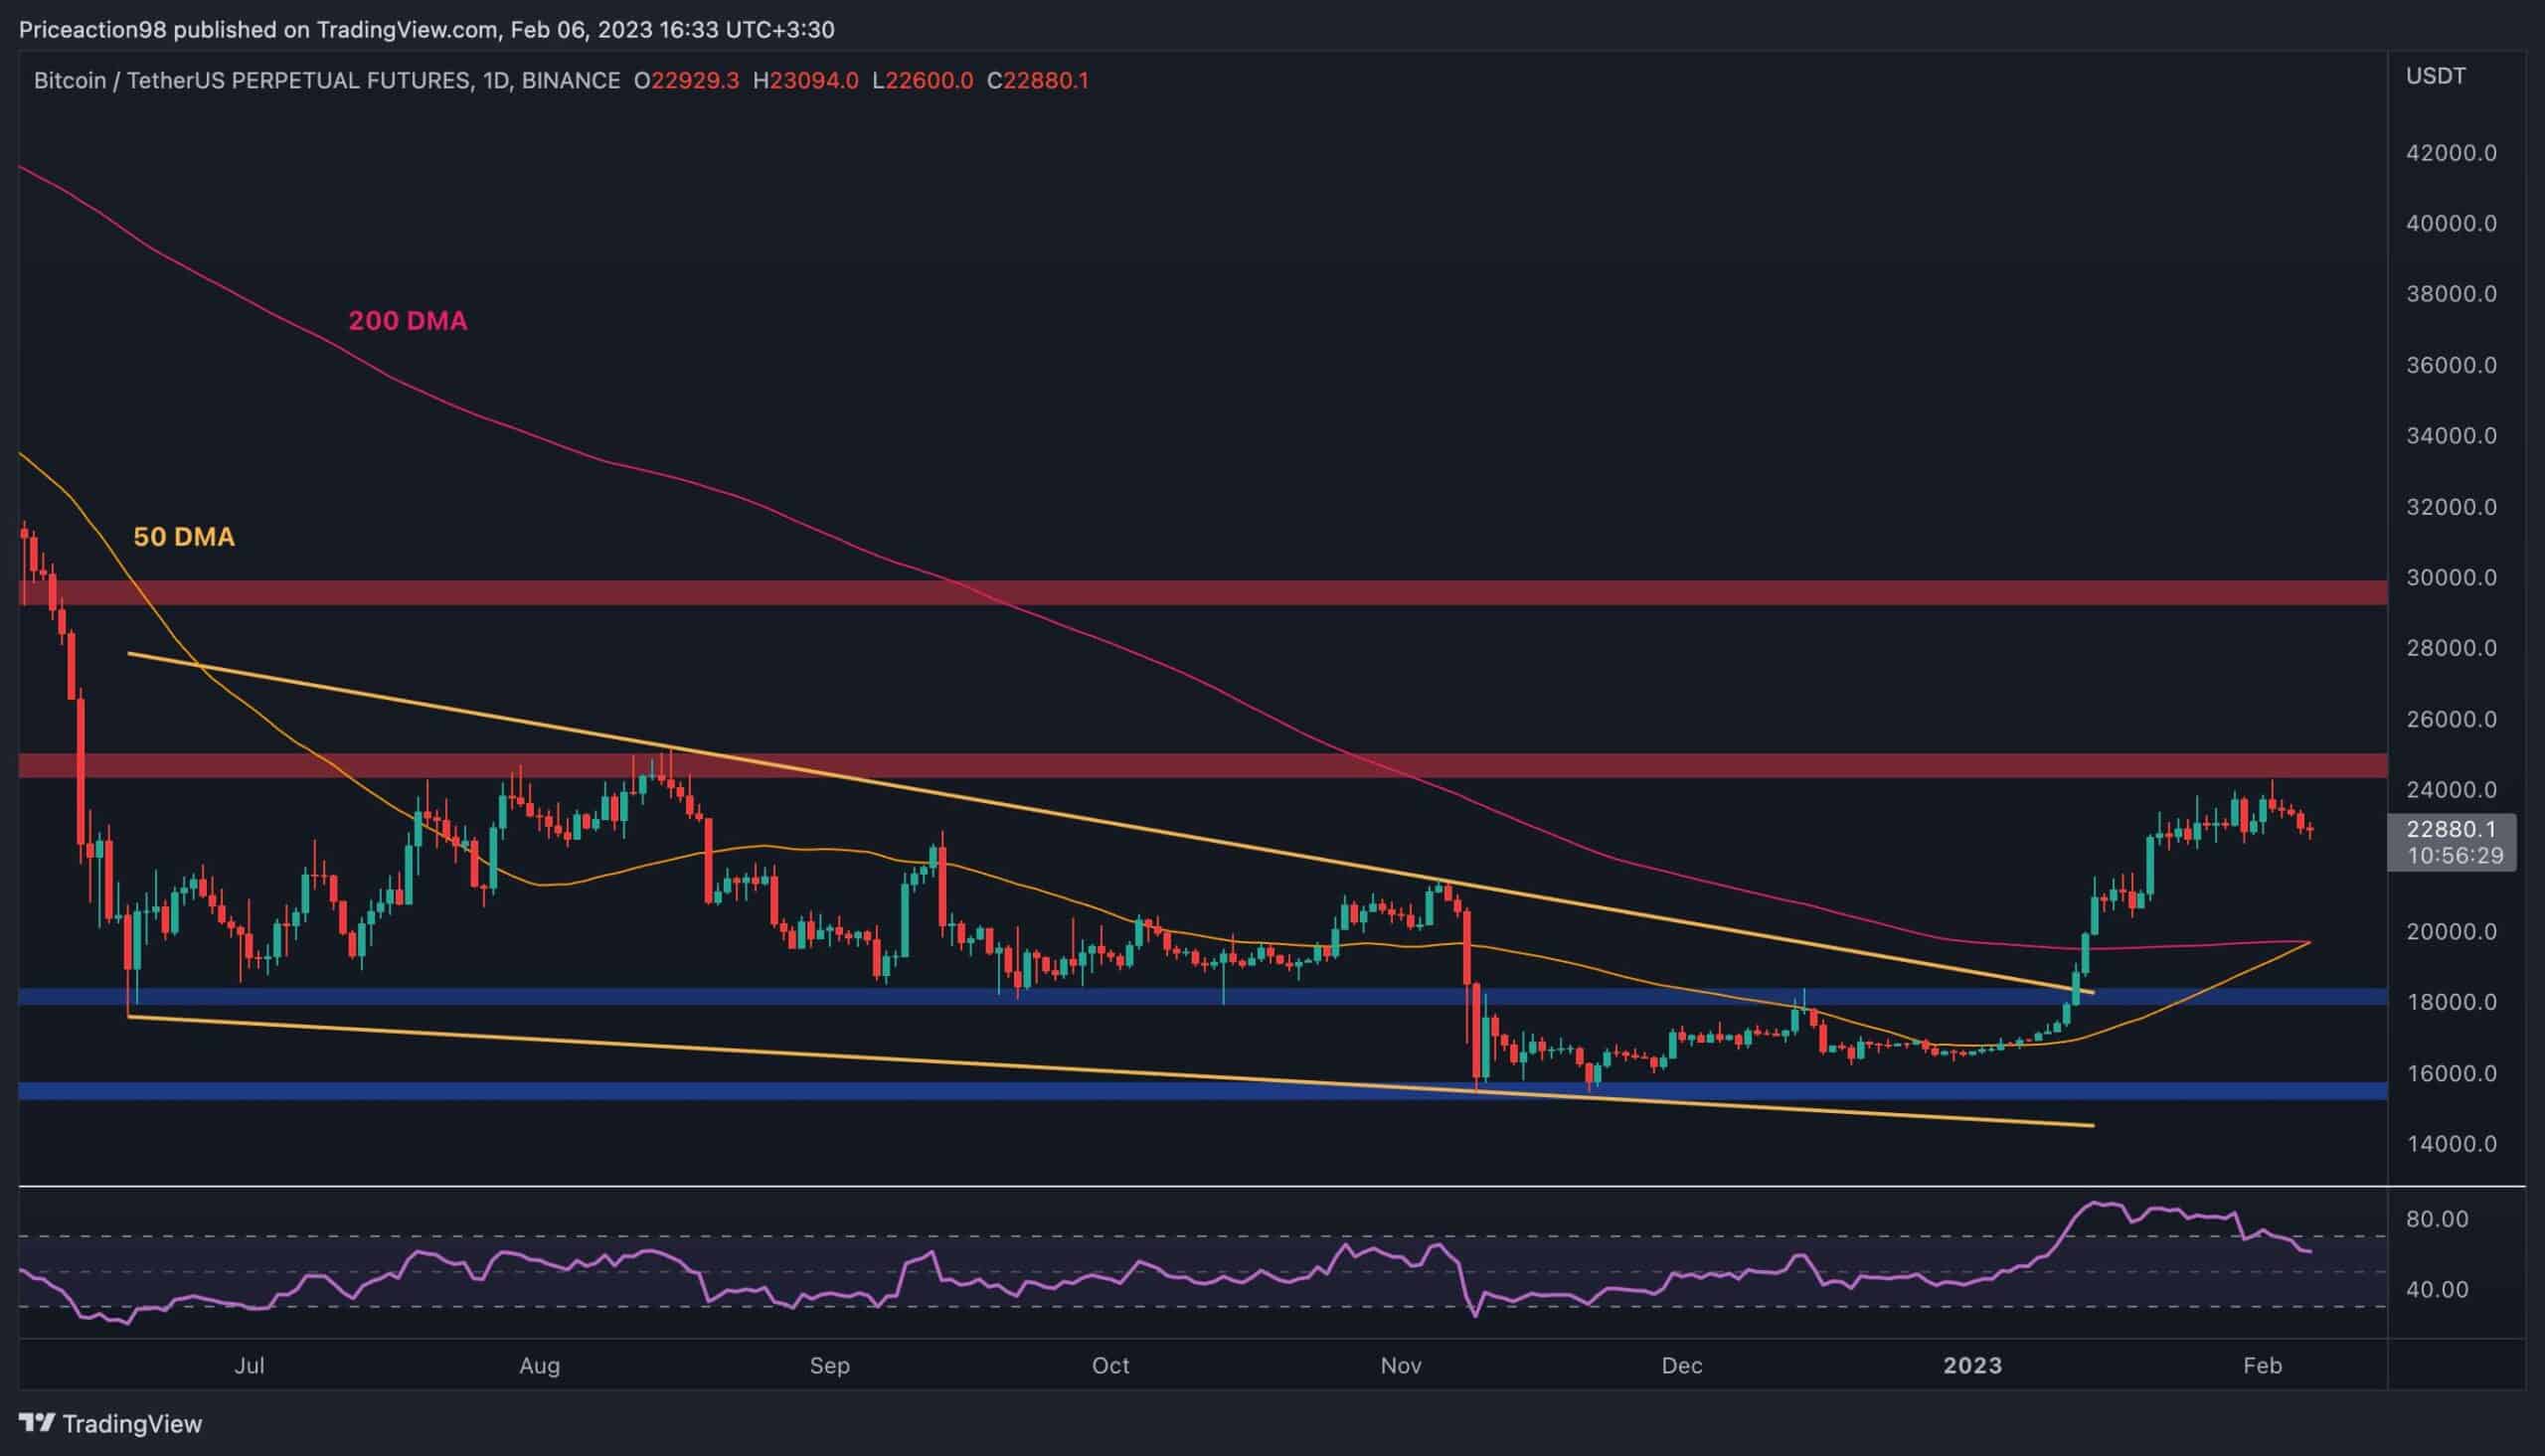
The Daily Chart
On the daily timeframe, the price has been consolidating below the $25K resistance area as of late. Recent daily candles suggest the bullish momentum is fading. The RSI also confirms this, as it has dropped below the 70% level, indicating that the market has entered a pullback phase.
However, the 50-day moving average is on the verge of crossing the 200-day moving average to the upside around the $20K mark, which is known as a very bullish signal for the mid-term.
Therefore, while a short-term pullback seems imminent, the market could rally again soon and break above the $25K level.
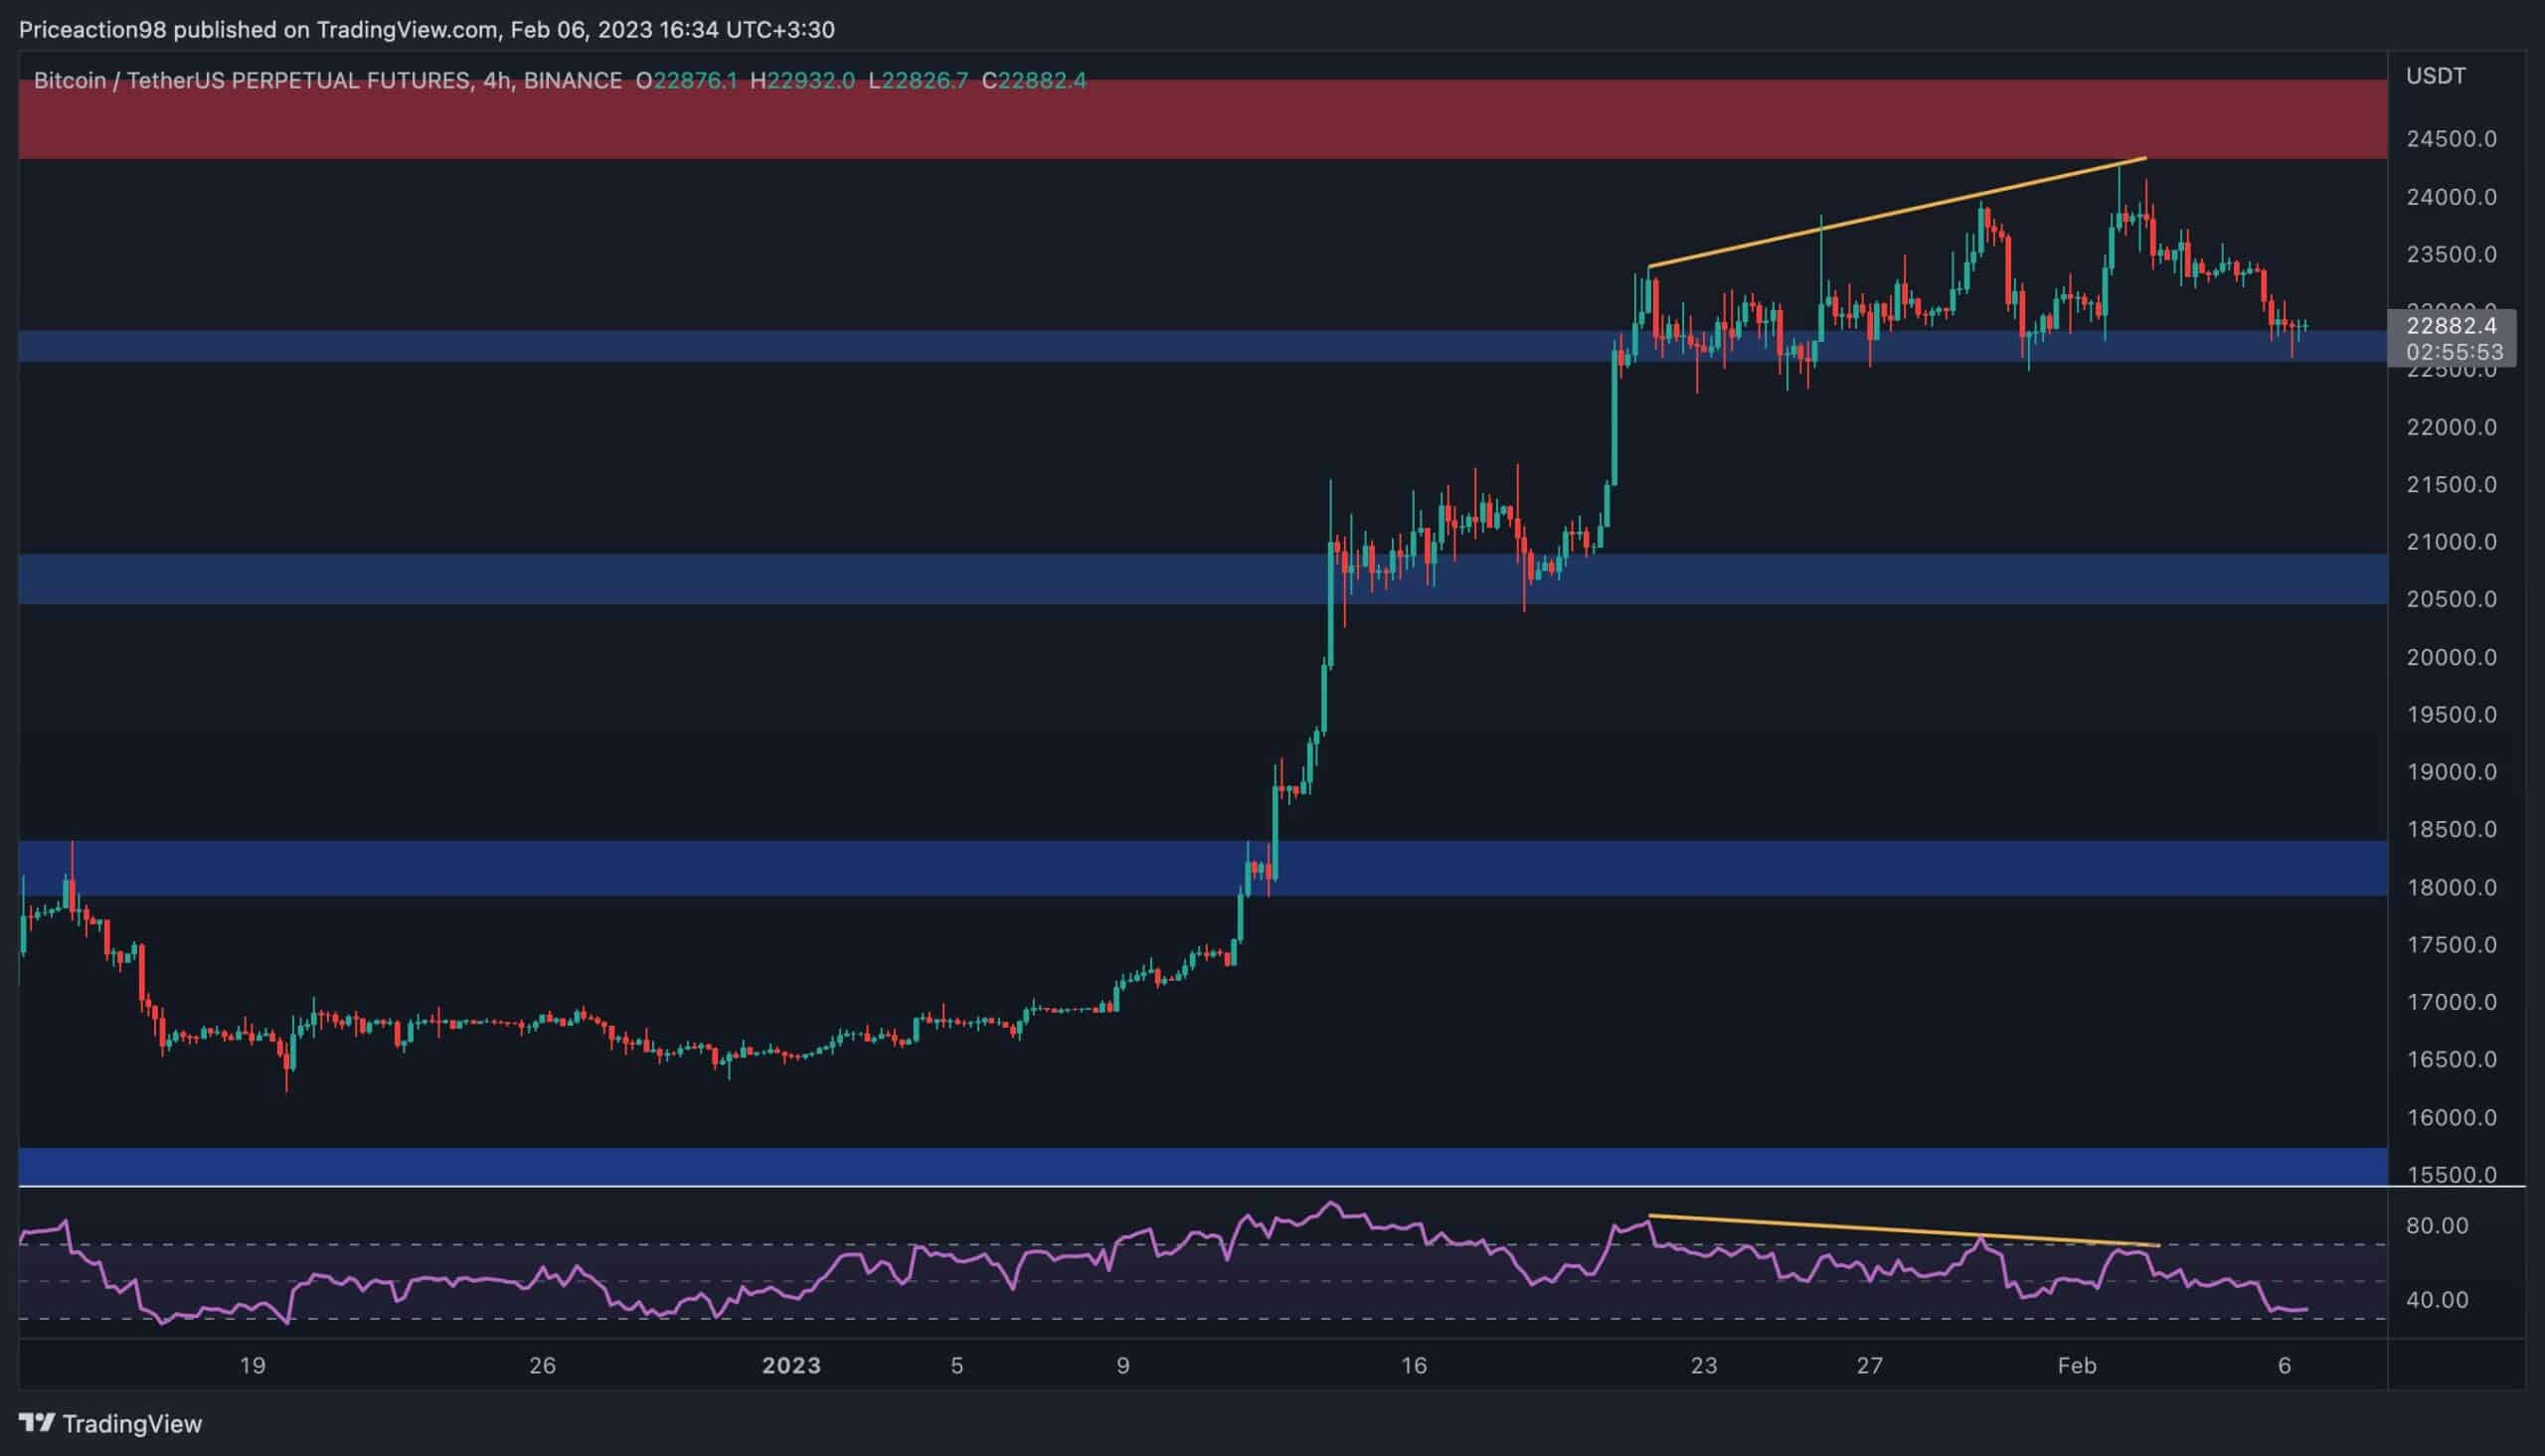
The 4-Hour Chart
In the 4-hour chart, the price has yet to break out of the tight range between the $24,000 and $22,500 levels. Currently, the lower boundary of this range is being tested and could finally break it to the downside, which could cause the market to drop towards the $21K area in the short term.
The RSI indicator has been demonstrating a clear bearish divergence over the past few days. However, it is now also pointing to the dominance of the sellers, as this oscillator is showing values below the 50% threshold.
To conclude, a bearish breakdown of the $22,500 level seems highly probable at the moment, as a deeper pullback seems imminent.
On-chain Analysis
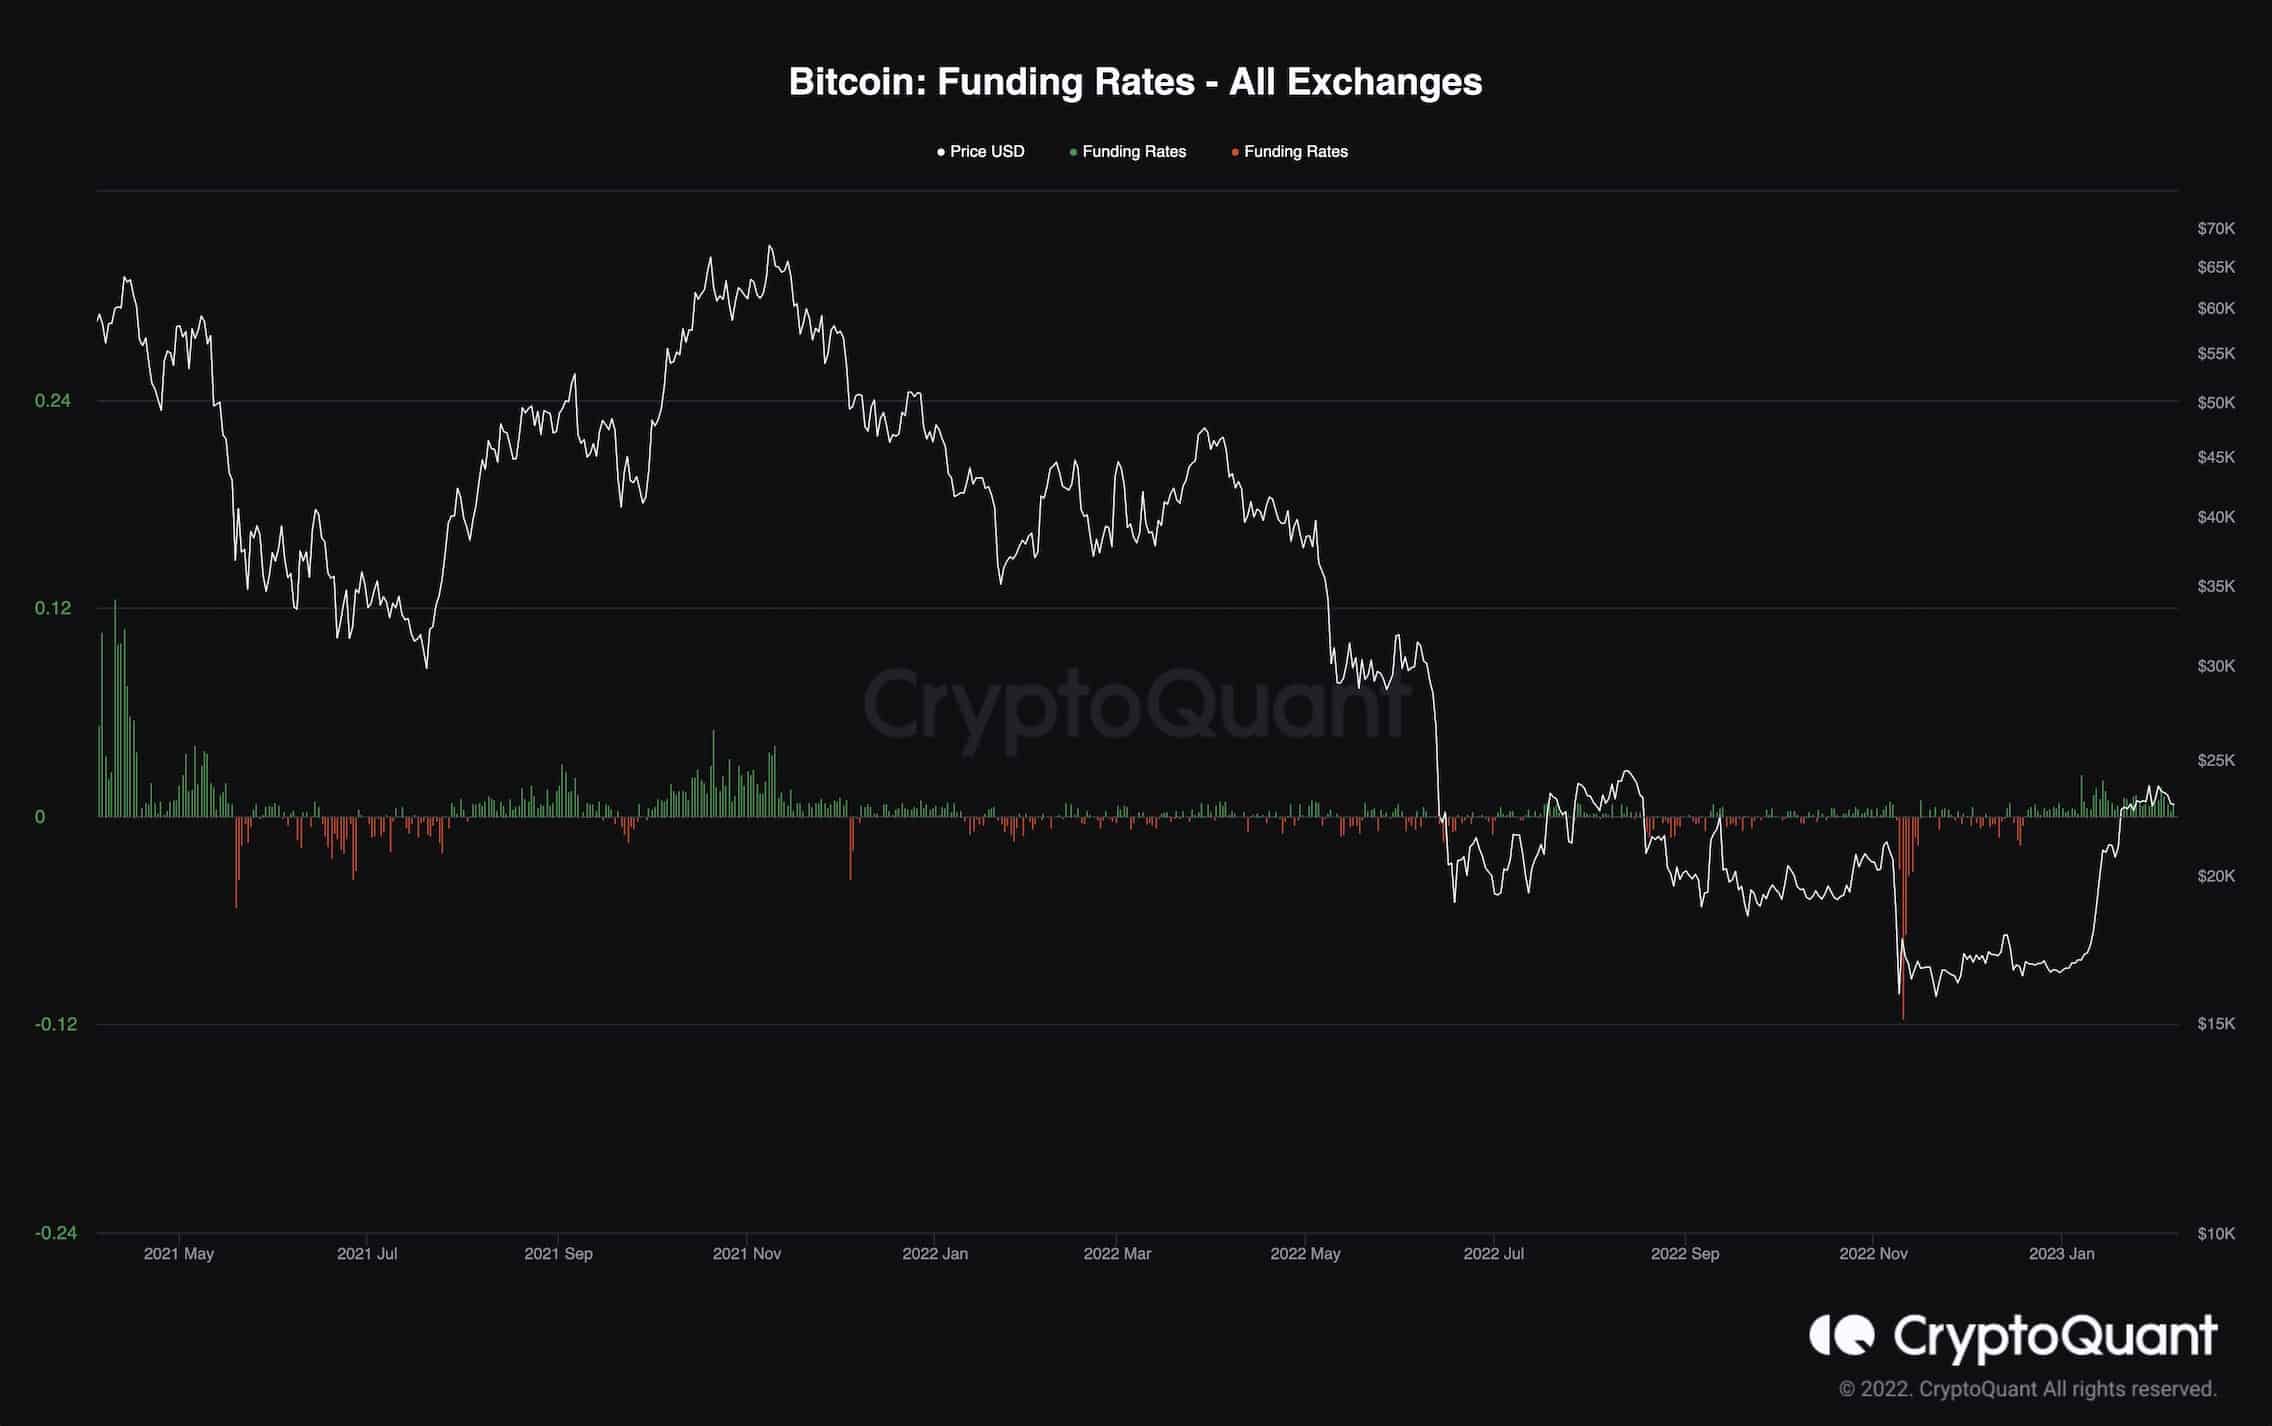
Bitcoin Funding Rates
Following the recent increase in the price, investors are turning bullish once more on Bitcoin. The futures market is demonstrating a positive sentiment signal, but there are some concerning signs too.
The below chart demonstrates the funding rates metric, which indicates whether the perpetual futures market sentiment is bullish or bearish. Values above 0 are associated with the bullish sentiment, while values below 0 show bearish sentiment.
This metric has been demonstrating positive values over the last few weeks, indicating that the investors are bullish and have been buying more aggressively in the futures market. However, during the recent consolidation, the funding rates metric has maintained positive values, with the price failing to rise.
This could be a negative signal if things do not change, as it could mean that selling pressure has been increasing, and a decline in price could lead to another significant long liquidation cascade, which would likely cause a price plunge in the short term.
Binance Free $100 (Exclusive): Use this link to register and receive $100 free and 10% off fees on Binance Futures first month (terms).
PrimeXBT Special Offer: Use this link to register & enter POTATO50 code to receive up to $7,000 on your deposits.
Disclaimer: Information found on CryptoPotato is those of writers quoted. It does not represent the opinions of CryptoPotato on whether to buy, sell, or hold any investments. You are advised to conduct your own research before making investment any decisions. Use provided information at your own risk. See Disclaimer for more information.
Cryptocurrency charts by TradingView.
[ad_2]
Source link