")
[ad_1]
The overall Bitcoin price action is on an impulsive decline after experiencing a significant rejection from a long-lasting resistance level at $18k. Failing the support level at $15k, the bulls could be in for a lot of trouble soon.
technical analysis
By: Edris
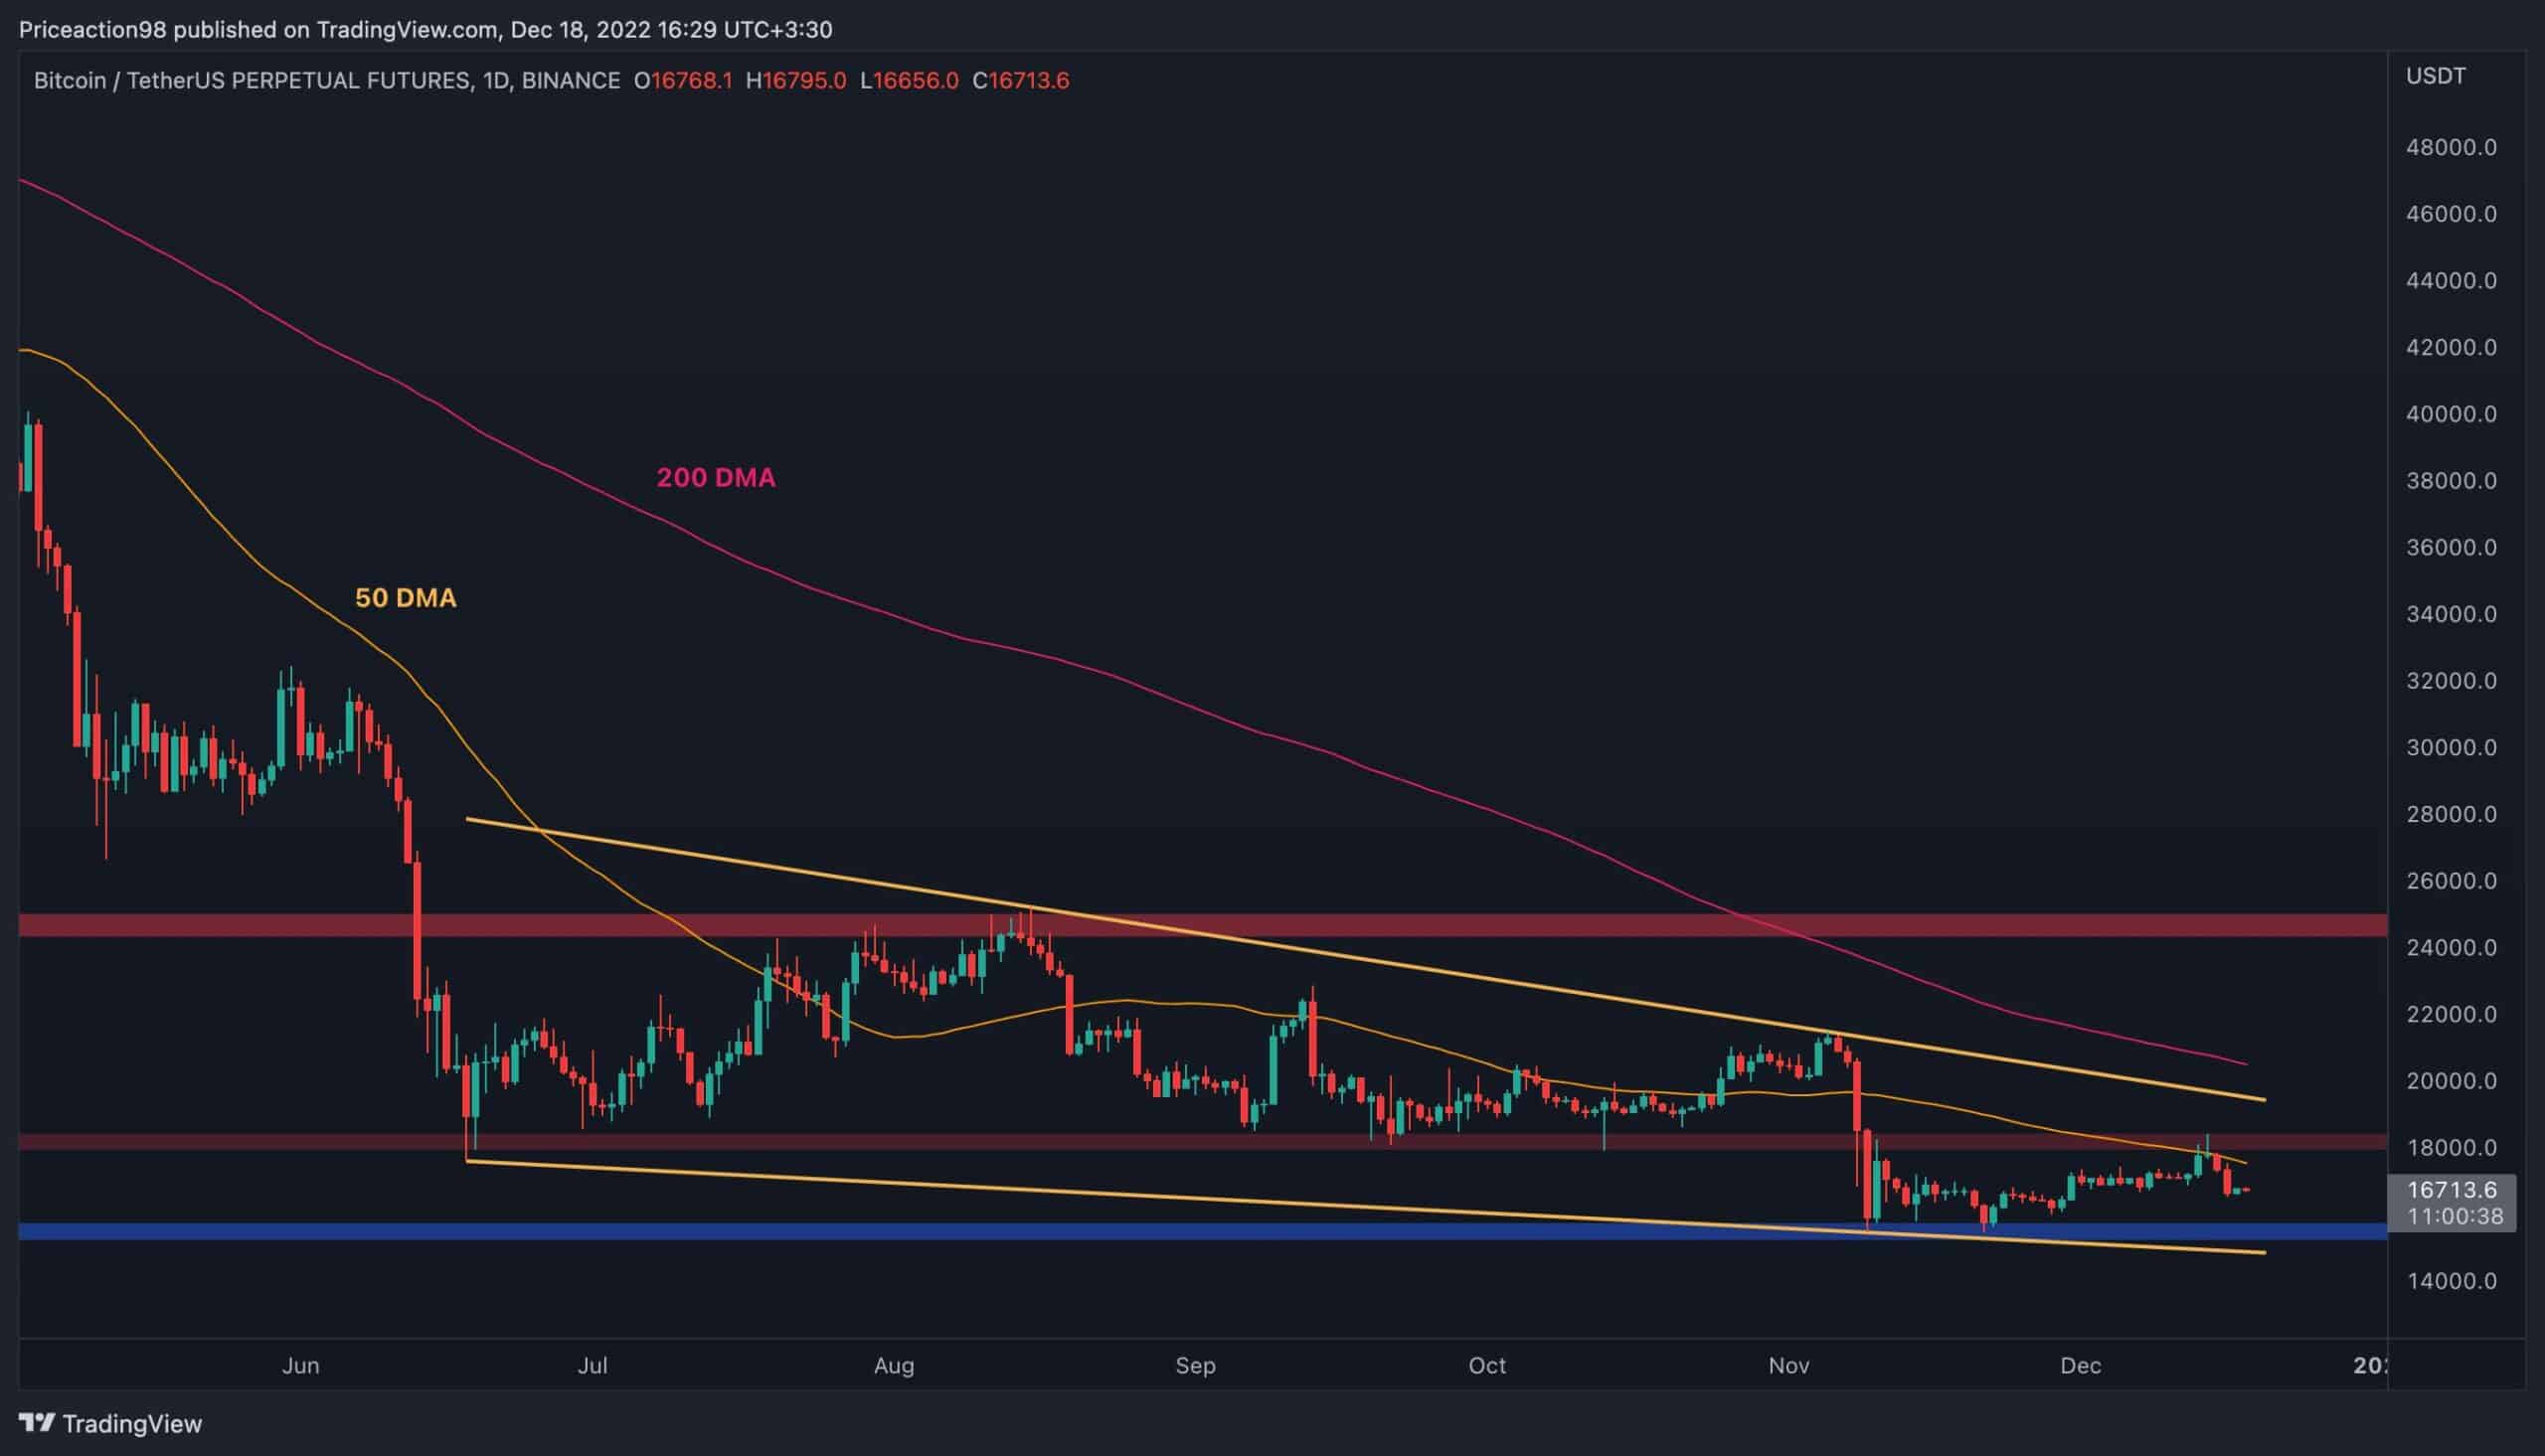
The Daily Chart:
Looking at the daily chart, the price oscillates in the large falling wedge pattern. While this is usually a reversal pattern in a downtrend if broken to the upside, the price has failed to reach the higher boundary as it got rejected from the $18K resistance level and the 50-day moving average located at the same price zone. Currently, a drop down to the $15K support area seems possible, as no other significant support level is left in the way.
However, the $15K area and the lower trendline of the falling wedge are located very close, increasing the chance to support the price and push it towards the $18K level once more. It would not be necessary to emphasize the importance of the mentioned support level, as its breakdown could lead to another blood bath.
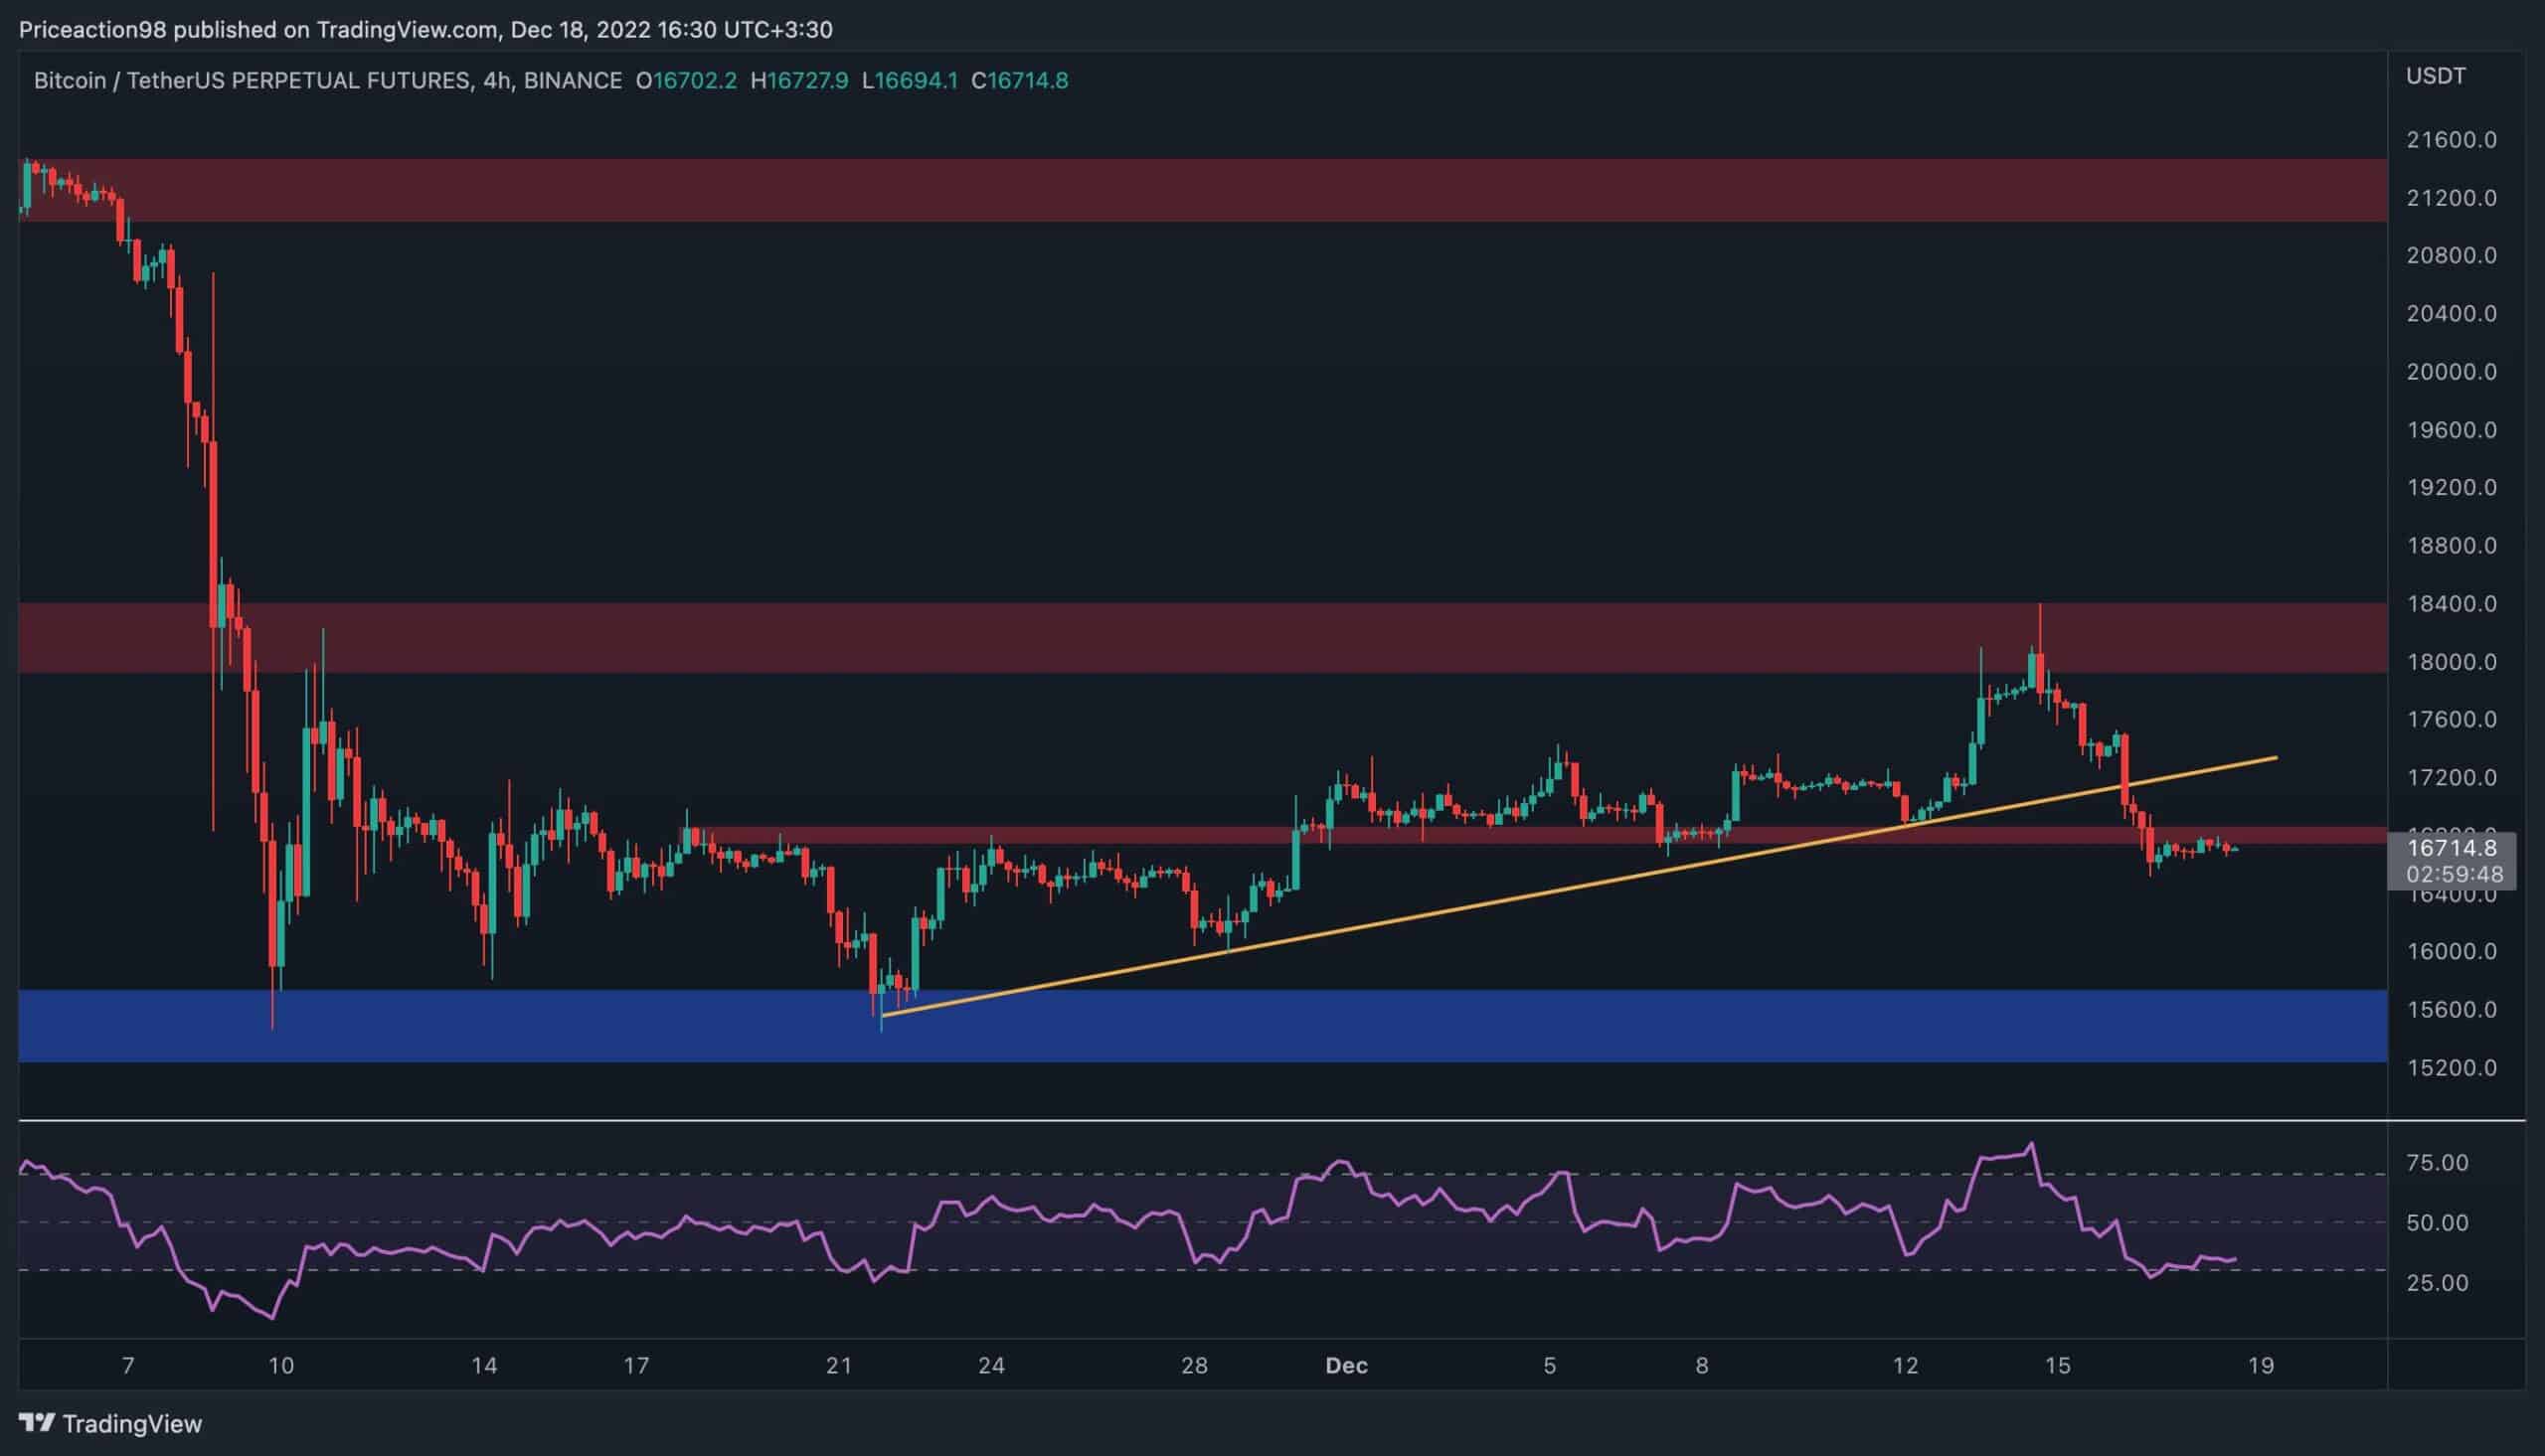
The 4-Hour Chart:
On the 4-hour timeframe, a classic bearish market structure is developing, similar to the higher timeframe. The price has broken below the $16,800 minor support level after failing the recently formed bullish trendline. The $16,800 level and the broken trendline are now considered resistance, while the former is already pushing the price to the downside.
Furthermore, the RSI indicator, while recovering from an oversold state, is way below the 50 mark, signaling a strong bearish momentum that could soon bring the price down towards the key $15,500 area.
On-chain Analysis
By: Edris
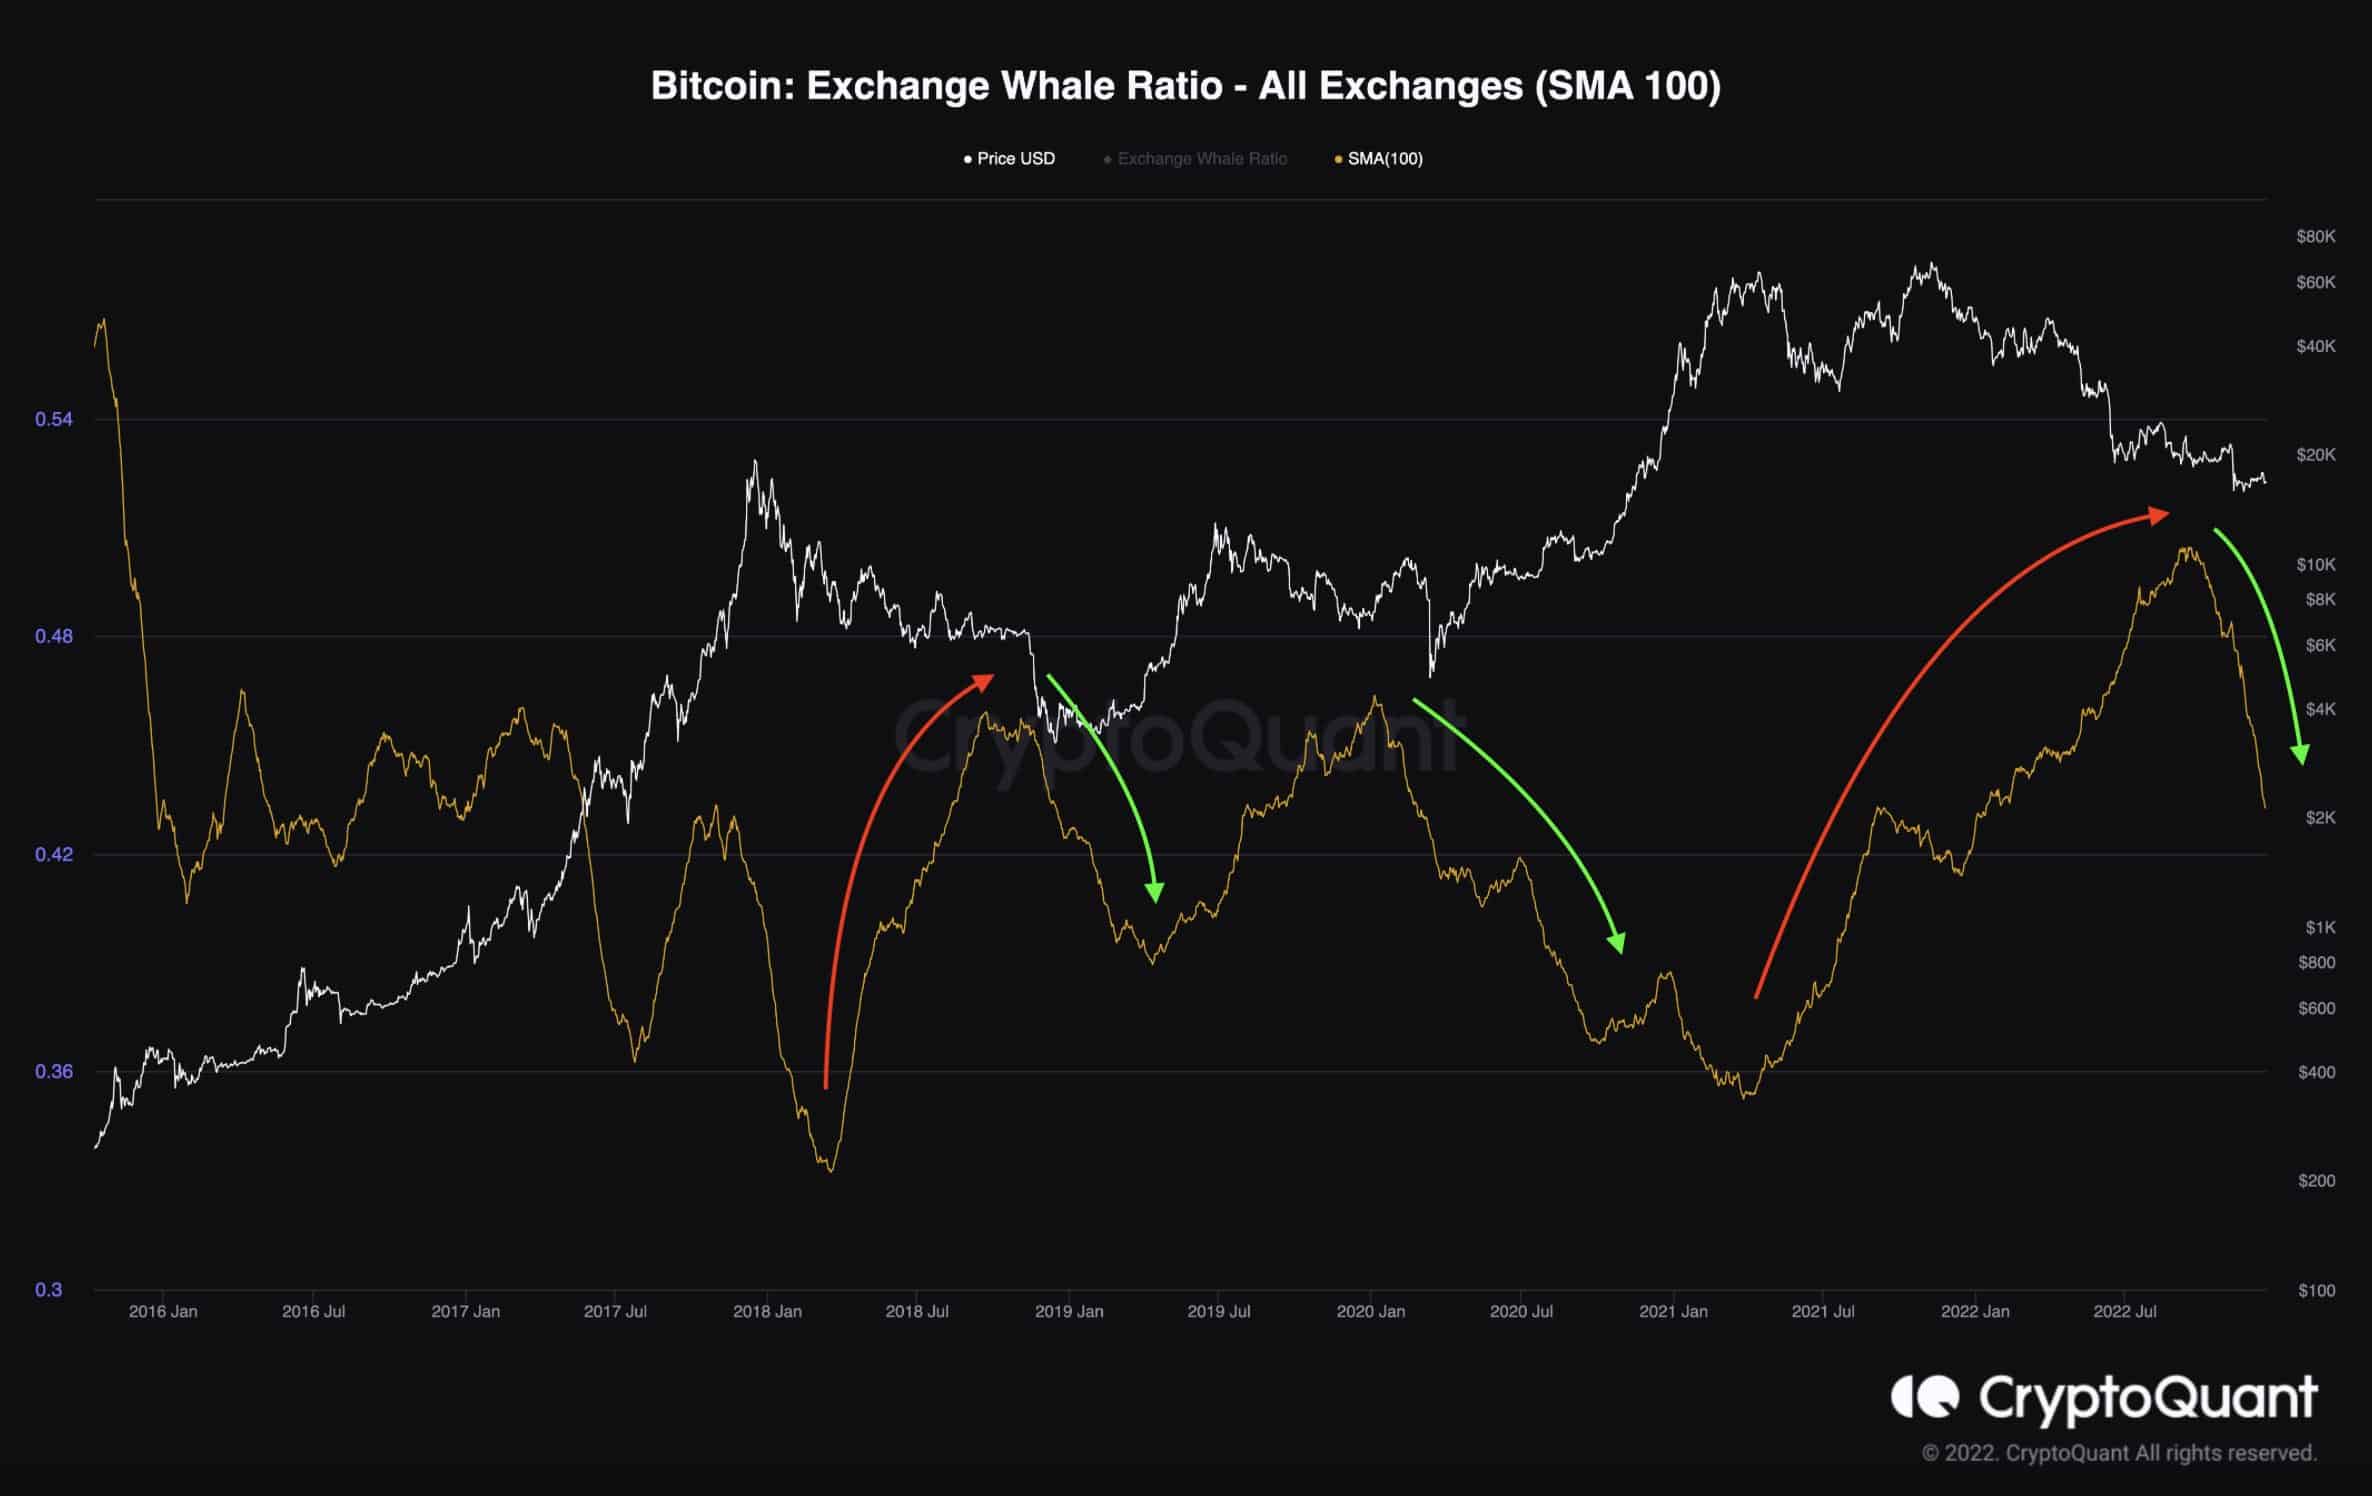
Bitcoin Exchange Whale Ratio
The Exchange Whale ratio metric is typically used to demonstrate whales’ behavior, as it is calculated by dividing the inflow of whales to the exchanges by the total inflows daily. During the last cycle and the first phase of the 2018 bear market, this metric was on a significant rise as many whales were selling their coins on the exchanges to protect their profits and reduce their risk. This behavior led to a gruesome downtrend. However, the metric started a downtrend in the second phase, as the price began to recover and start a new bull run.
Recently, the same behavior has been witnessed as the whales are depositing less onto coins the exchanges compared to the rest of the market participants, which could signal that a price bottom could be near. However, this could also be a consequence of FTX’s insolvency and eventual bankruptcy, as the whales do not trust the exchanges enough to hold their coins on them. This decline in the Whale Ratio metric could trigger a potential supply shock and finally lead to a price bottom formation soon.
Binance Free $100 (Exclusive): Use this link to register and receive $100 free and 10% off fees on Binance Futures first month (terms).
PrimeXBT Special Offer: Use this link to register & enter POTATO50 code to receive up to $7,000 on your deposits.
Disclaimer: Information found on CryptoPotato is those of writers quoted. It does not represent the opinions of CryptoPotato on whether to buy, sell, or hold any investments. You are advised to conduct your own research before making investment any decisions. Use provided information at your own risk. See Disclaimer for more information.
Cryptocurrency charts by TradingView.
[ad_2]
Source link