")
[ad_1]
Bitcoin’s price has been consolidating following the recent recovery. While the market structure has shifted bullish in the short term, there is still a key level for the price to take out to begin a new bull market.
technical analysis
By: Edris
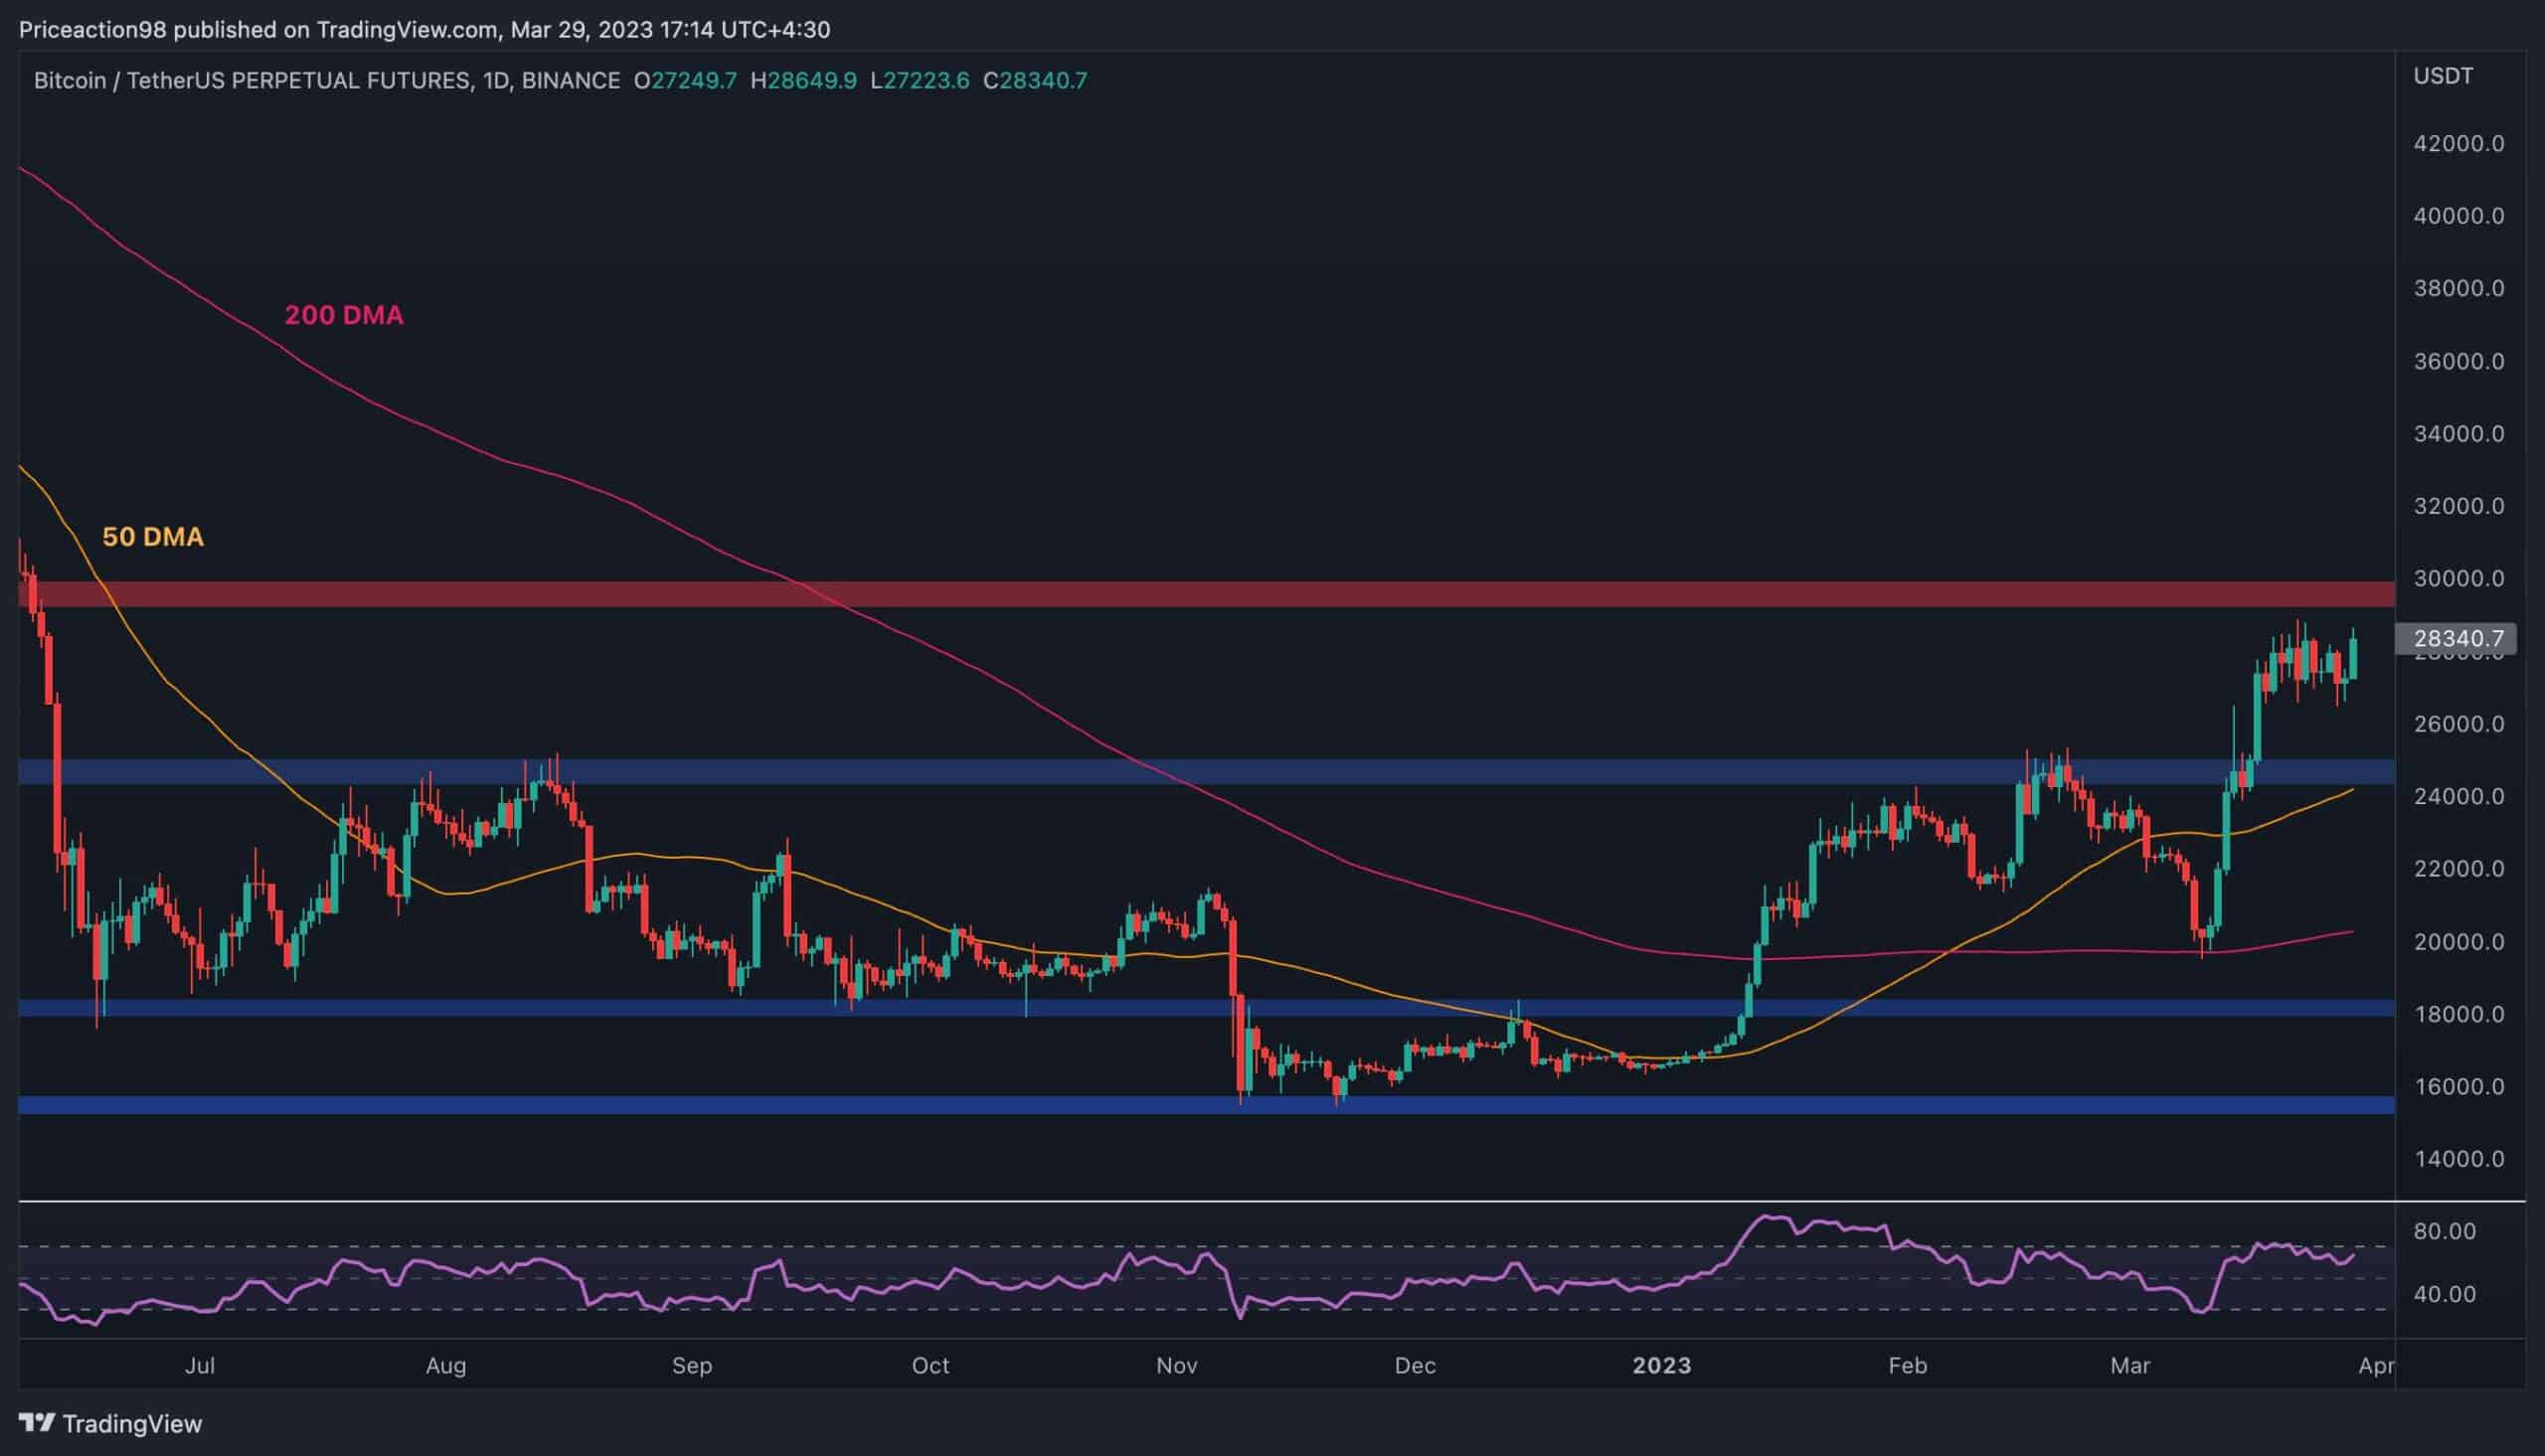
The Daily Chart:
On the daily chart, it can be seen that the price has been ranging below the $30K level over the last 10 days. Yet, today’s candle is showing promising momentum to the upside, and the price could finally test the key $30K resistance level in the coming days.
A break above the $30K area would boost the probability of a new bull market significantly. On the other hand, a potential rejection from the mentioned area could lead to a drop back towards the $25K support zone. Moreover, the RSI indicator is showing considerable bullish momentum but is also approaching the overbought area and should be monitored closely.
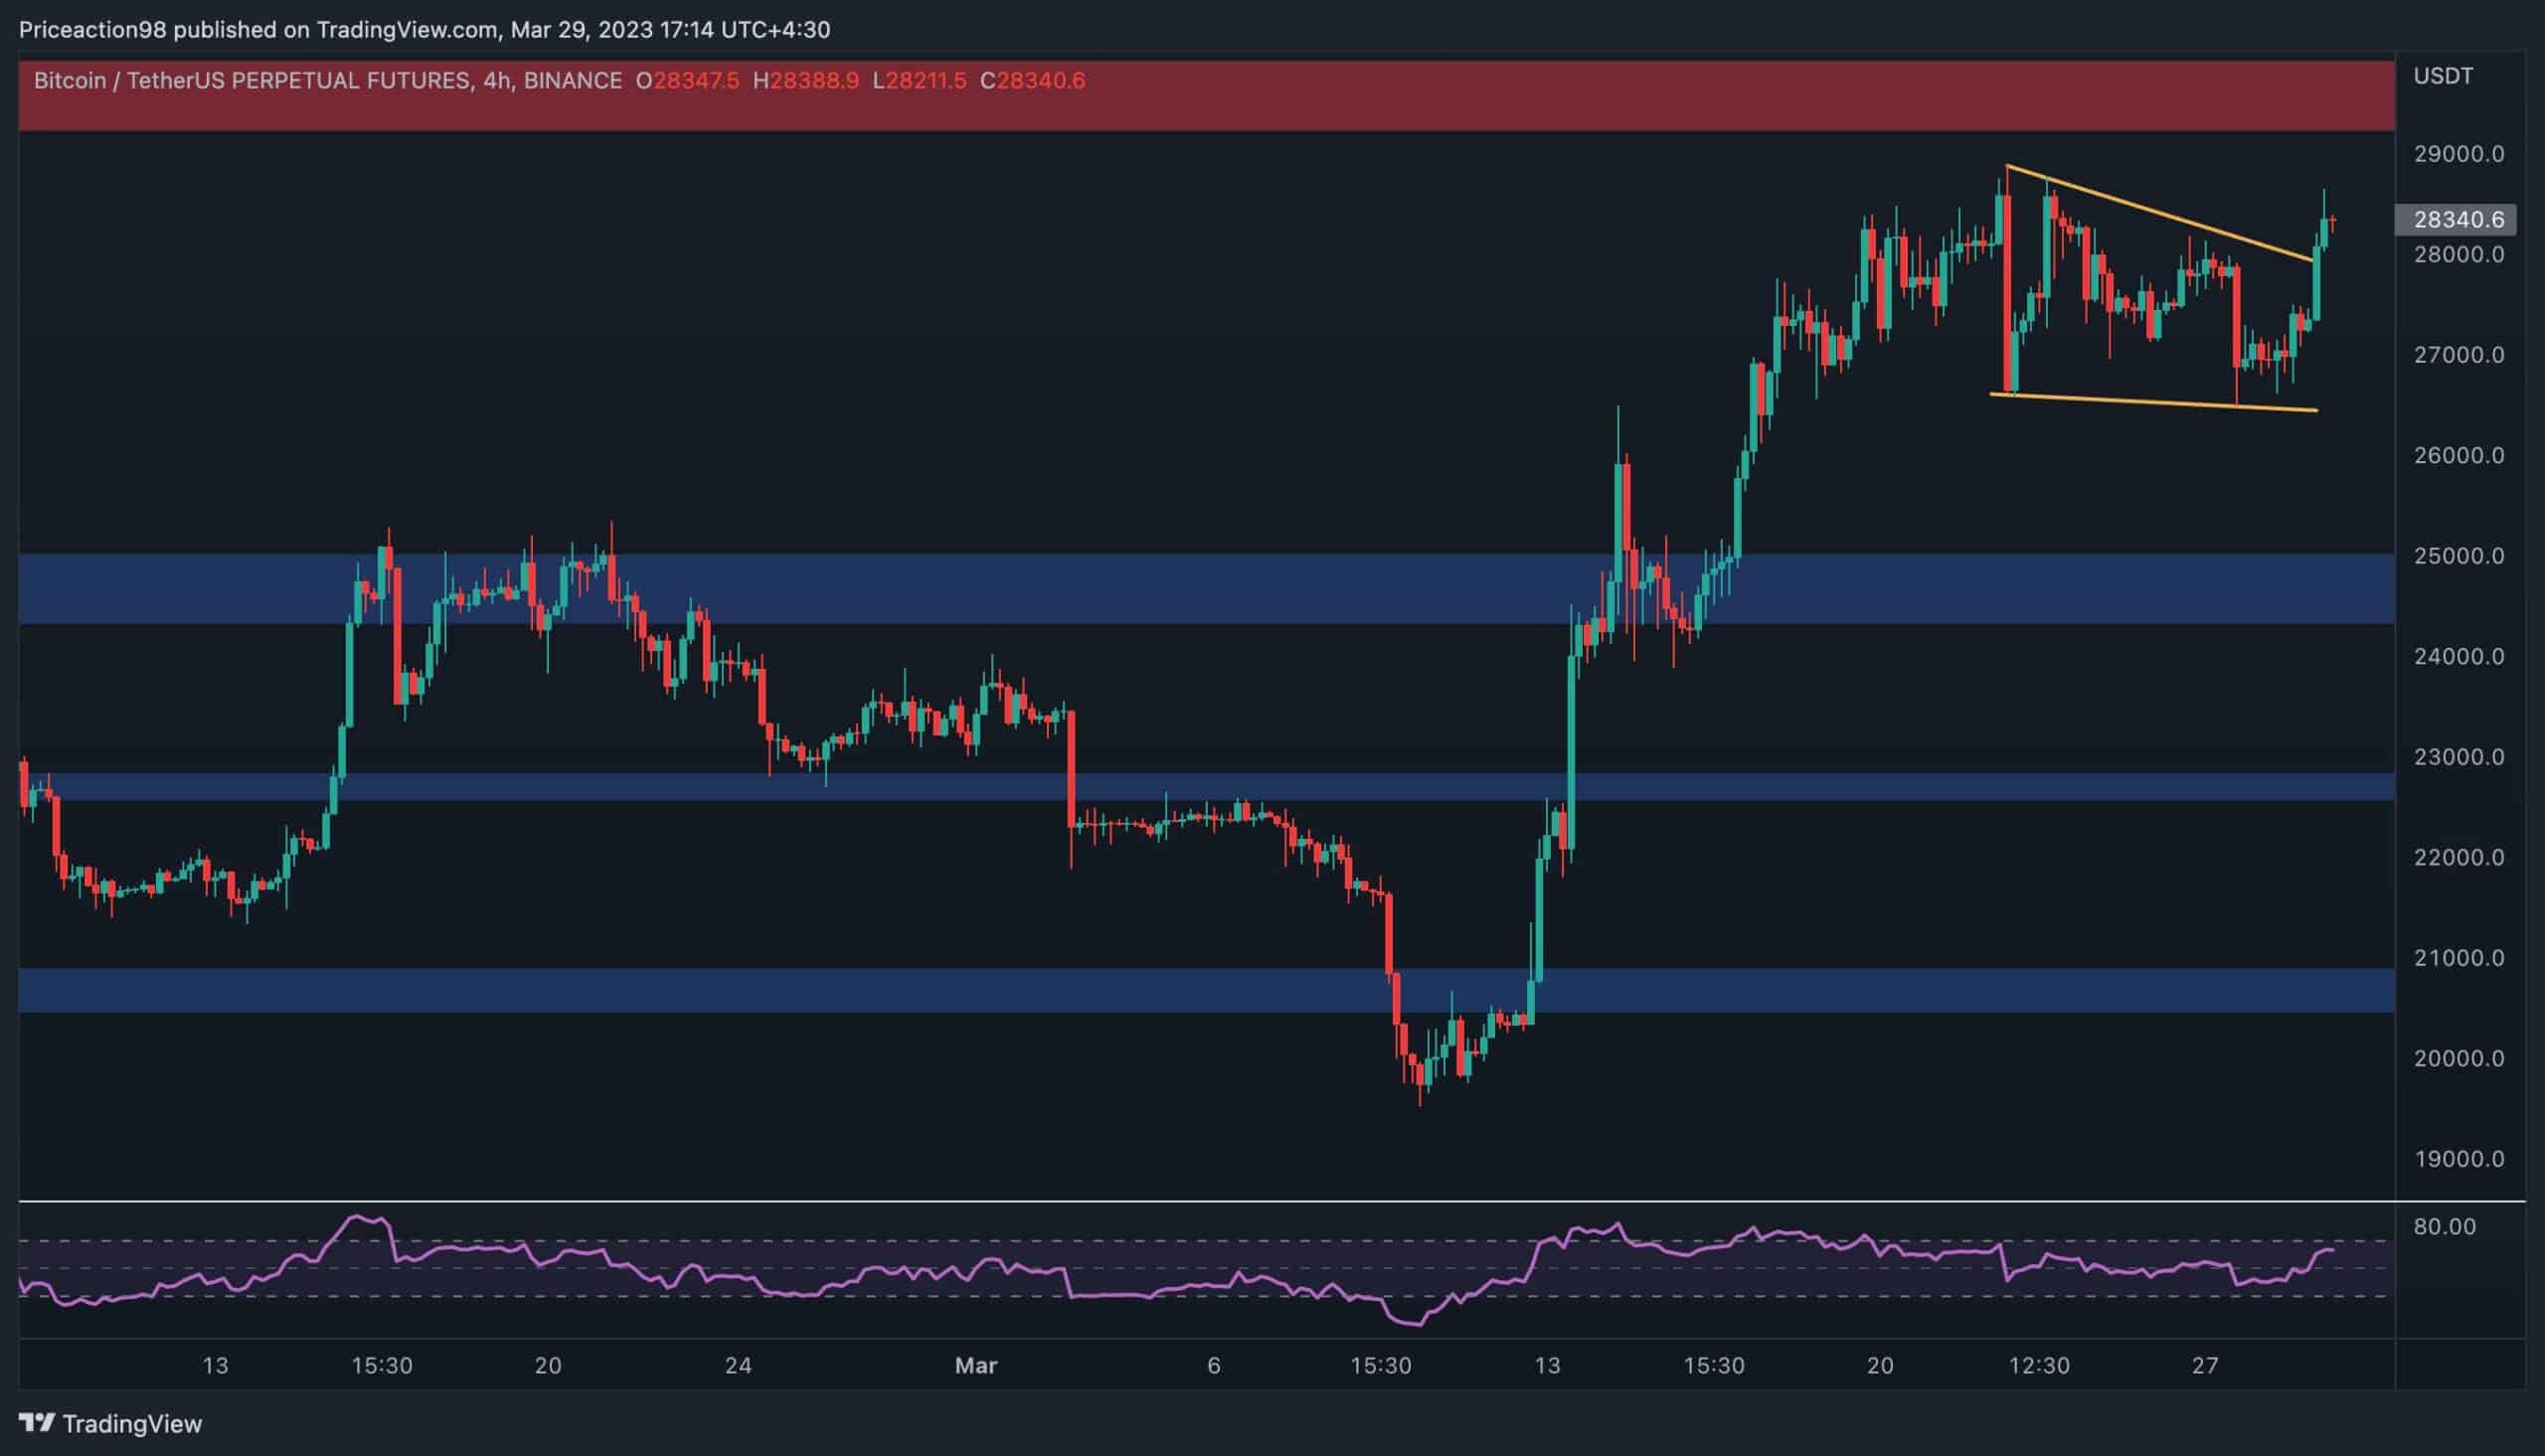
The 4-Hour Chart:
Looking at the 4-hour timeframe, a bullish market structure is clearly visible. The price has increased rapidly after rebounding from the $20K area and has broken above multiple levels. The recent consolidation also becomes clearer in this timeframe, as the price has supposedly been forming a bullish flag which is currently getting broken to the upside.
A valid breakout would pave the way for the market to test the $30K area. The RSI is also demonstrating a bullish signal in this timeframe, as the oscillator has broken back above the 50% threshold, which is considered positive and points to the current upwards momentum.
On-chain Analysis
By: Edris
Bitcoin Exchange Outflow (Binance)
Following the recent CFTC allegations directed at Binance and its CEO, CZ, it could be useful to analyze the exchange and its users’ behavior. This chart demonstrates exchange outflow (30-day moving average), which measures the amount of BTC withdrawn from Binance daily.
Two significant rises in outflows have occurred recently, with the first and the bigger one happening during the formation of the $17K low. The second increase, which interests us more, has been happening since the beginning of March. There are two possible reasons for this trend.
Firstly, some investors are optimistic that a new bull market is on the horizon and are eager to withdraw their coins and store them in their personal wallets. Yet, the second reason could be related to the recent allegations, and some whales may have withdrawn their assets out of caution, as things could worsen for Binance.
Either way, while these crackdowns are generally bad for the crypto market in the short term, coins flowing out of exchanges would benefit the price in the long term as supply would shrink gradually.

Binance Free $100 (Exclusive): Use this link to register and receive $100 free and 10% off fees on Binance Futures first month (terms).
PrimeXBT Special Offer: Use this link to register & enter CRYPTOPOTATO50 code to receive up to $7,000 on your deposits.
Disclaimer: Information found on CryptoPotato is those of writers quoted. It does not represent the opinions of CryptoPotato on whether to buy, sell, or hold any investments. You are advised to conduct your own research before making investment any decisions. Use provided information at your own risk. See Disclaimer for more information.
Cryptocurrency charts by TradingView.
[ad_2]
Source link