")
[ad_1]
Ethereum’s price has recently rebounded and is currently testing a key area.
In case the bullish momentum carries on, the price is likely to head toward the $2,000 resistance zone in the near future.
Technical Analysis
By Edris
The Daily Chart
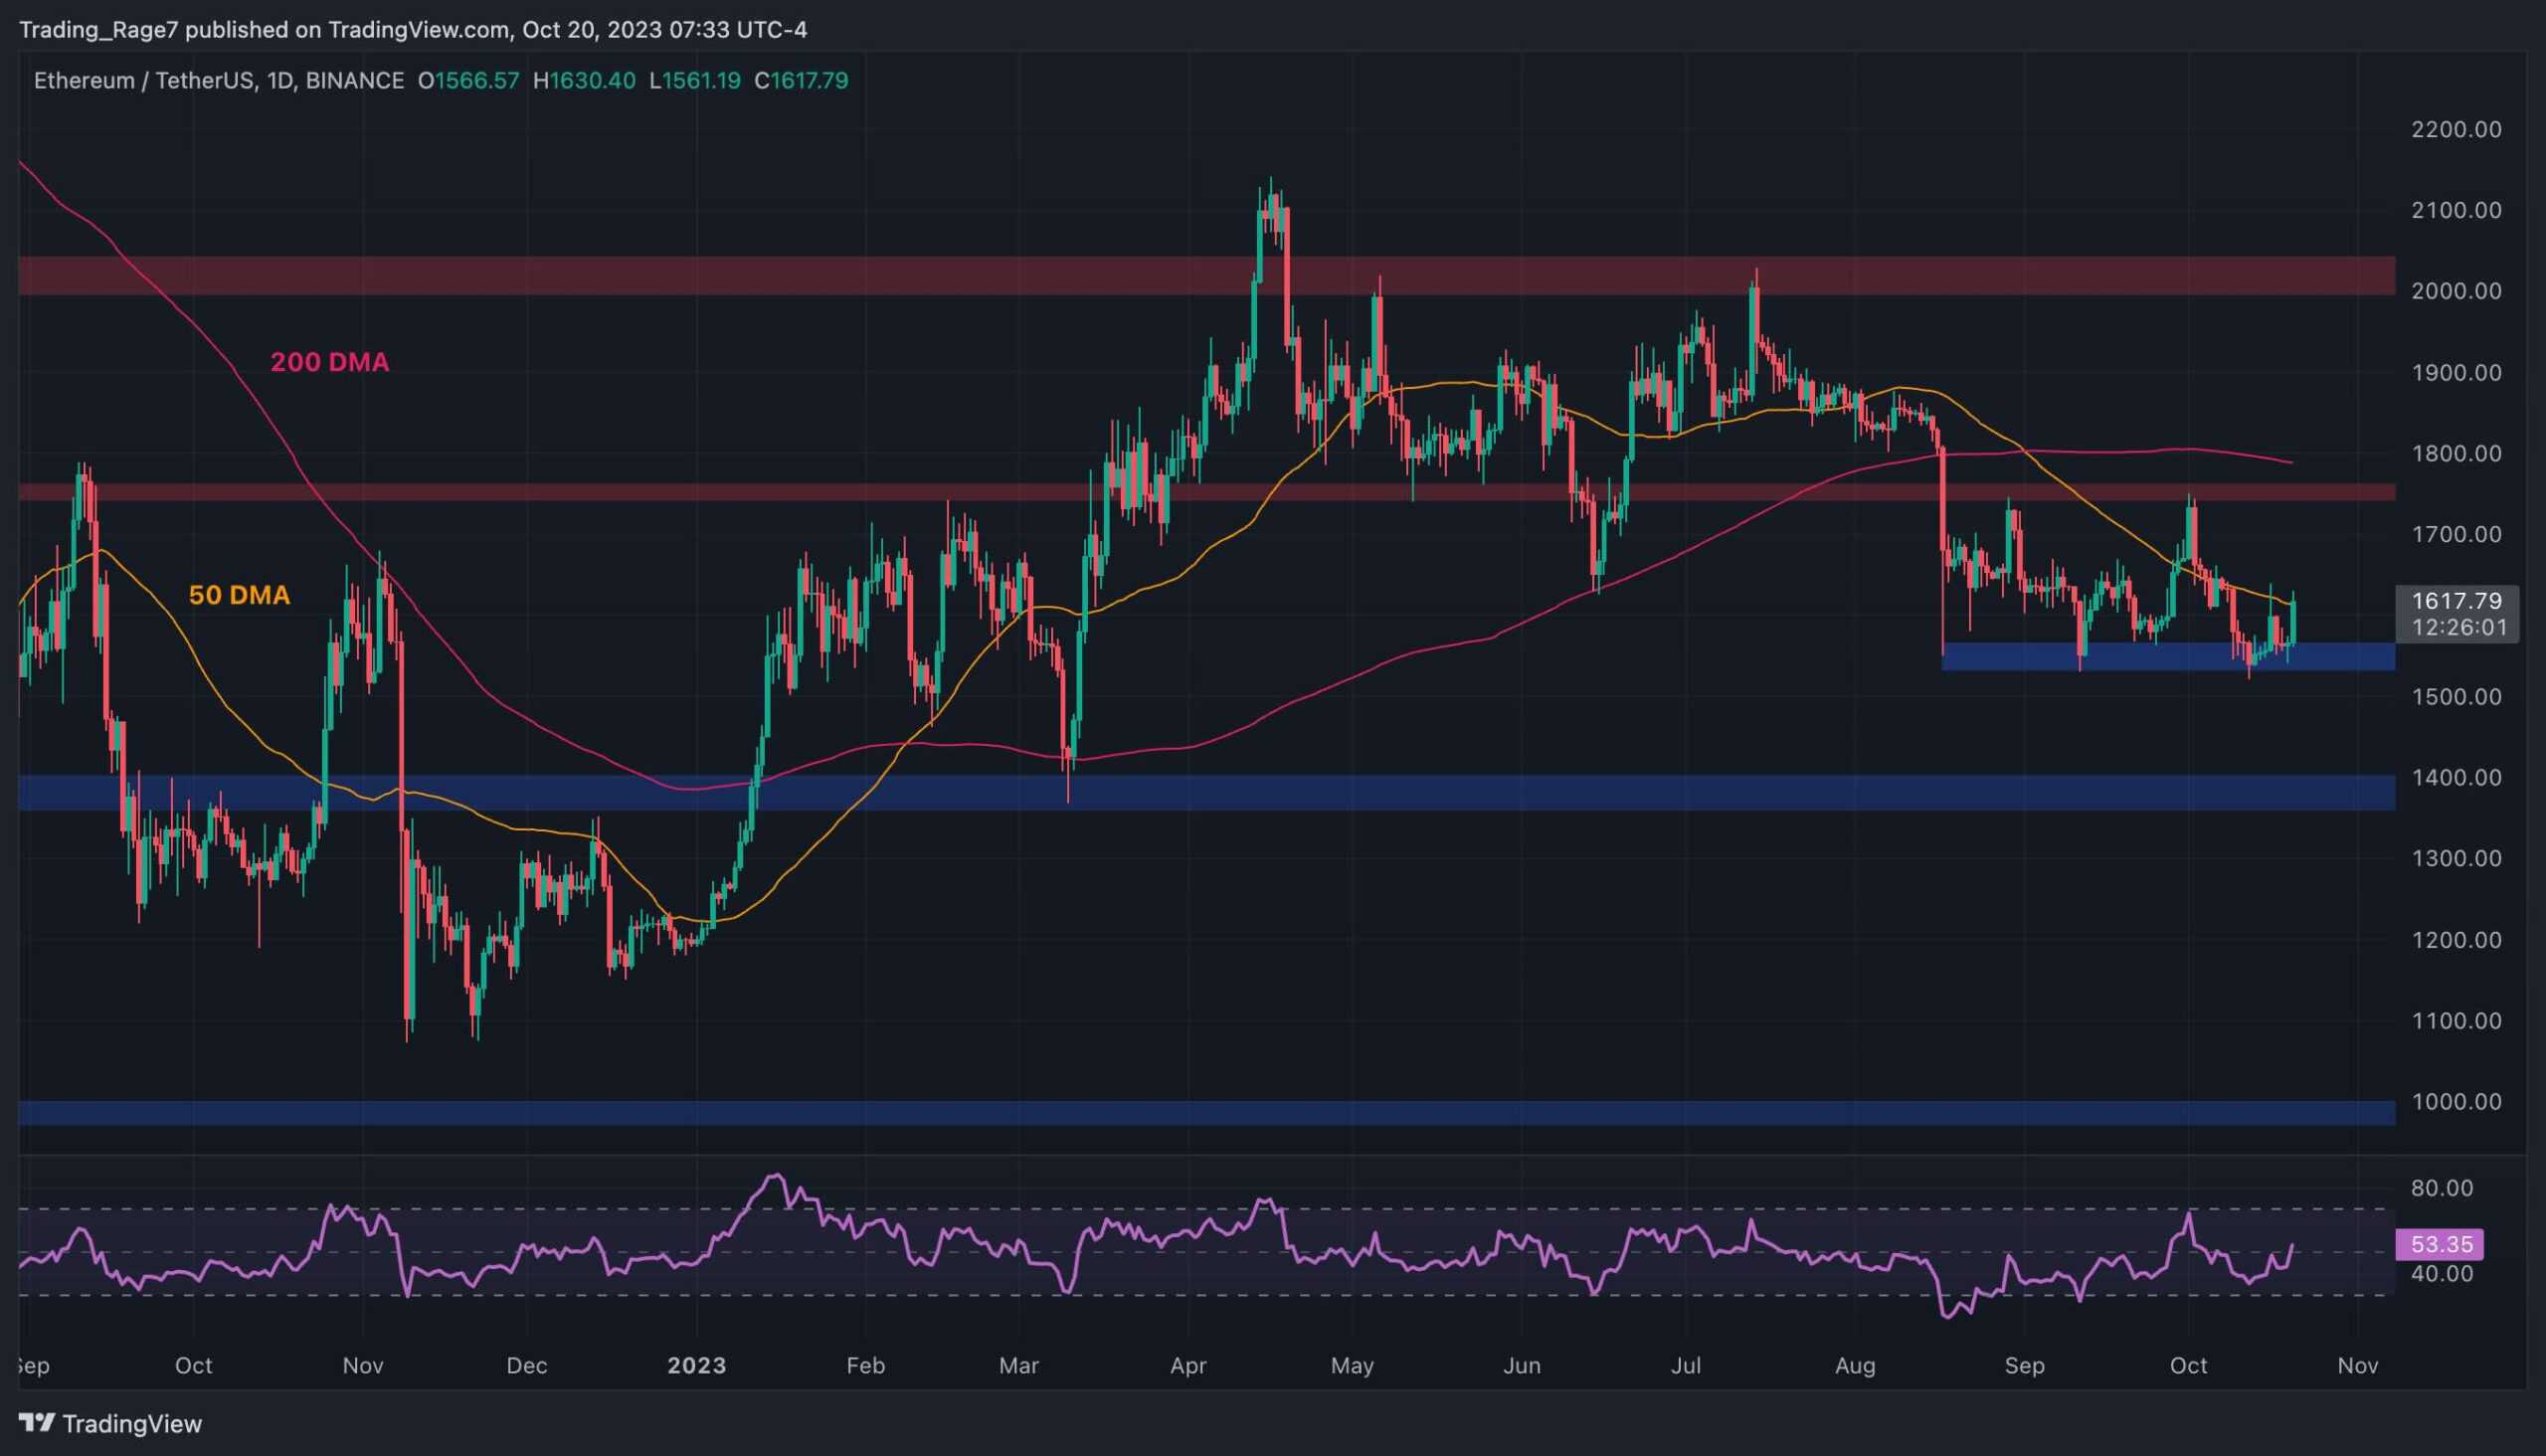
On the daily timeframe, the $1,550 support level has once again held the price, preventing it from dropping lower toward the $1,400 area. The 50-day moving average is currently being tested around $1,600.
If ETH breaks above, the $1,750 resistance level and the 200-day moving average located near the $1,800 mark are the next likely targets.
The RSI indicator has also risen above the 50% threshold, pointing to the fact that the momentum is in favor of the buyers once more.
The 4-Hour Chart
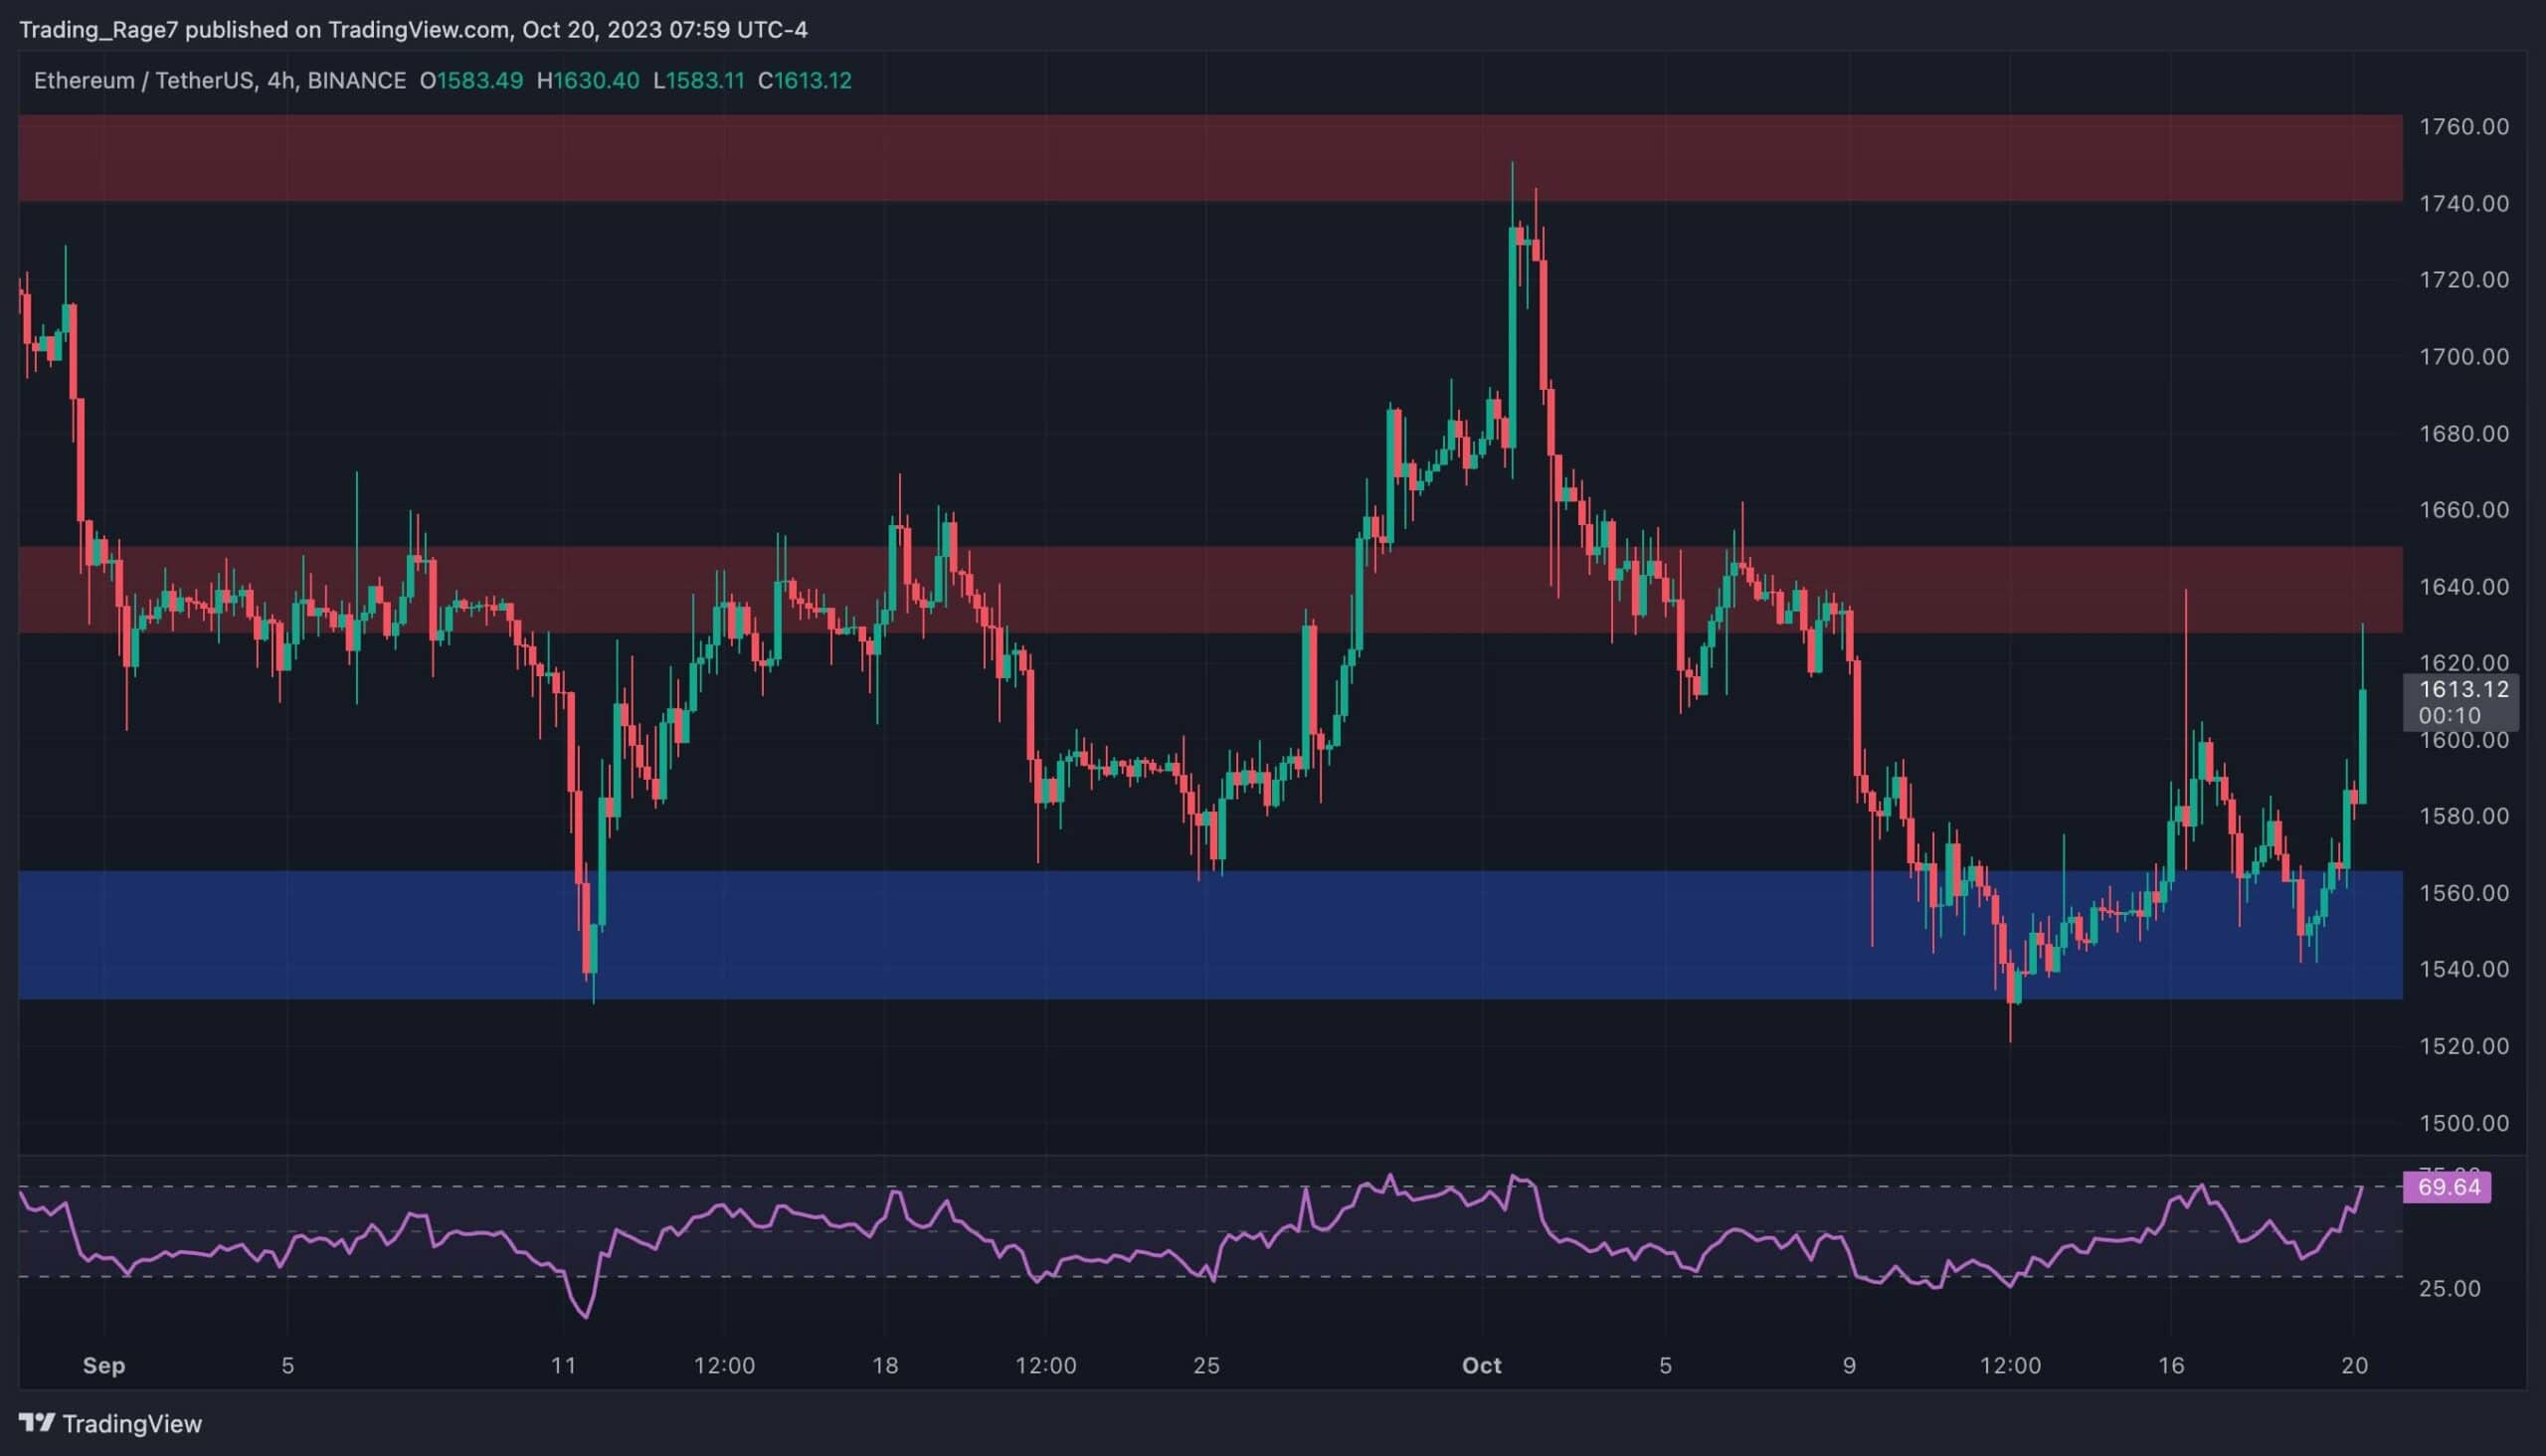
Looking at the 4-hour chart, it is evident that the price has been consolidating between the $1,550 and $1,750 levels for the past few months. However, the market has once again rebounded from the $1,550 level recently and is currently testing the $1,600 resistance zone.
A bullish breakout from this area would pave the way for a further rally toward $1,750 in the coming weeks. However, investors should keep an eye on the RSI indicator as it is entering the overbought region again, which could result in a rejection from the $1,600 zone.
On-Chain Analysis
By Edris
Ethereum’s price has recently shown upward momentum following months of consolidation and gradual decline. This PA has left investors wondering whether a new bullish phase is on the horizon or lower prices are still to be expected.
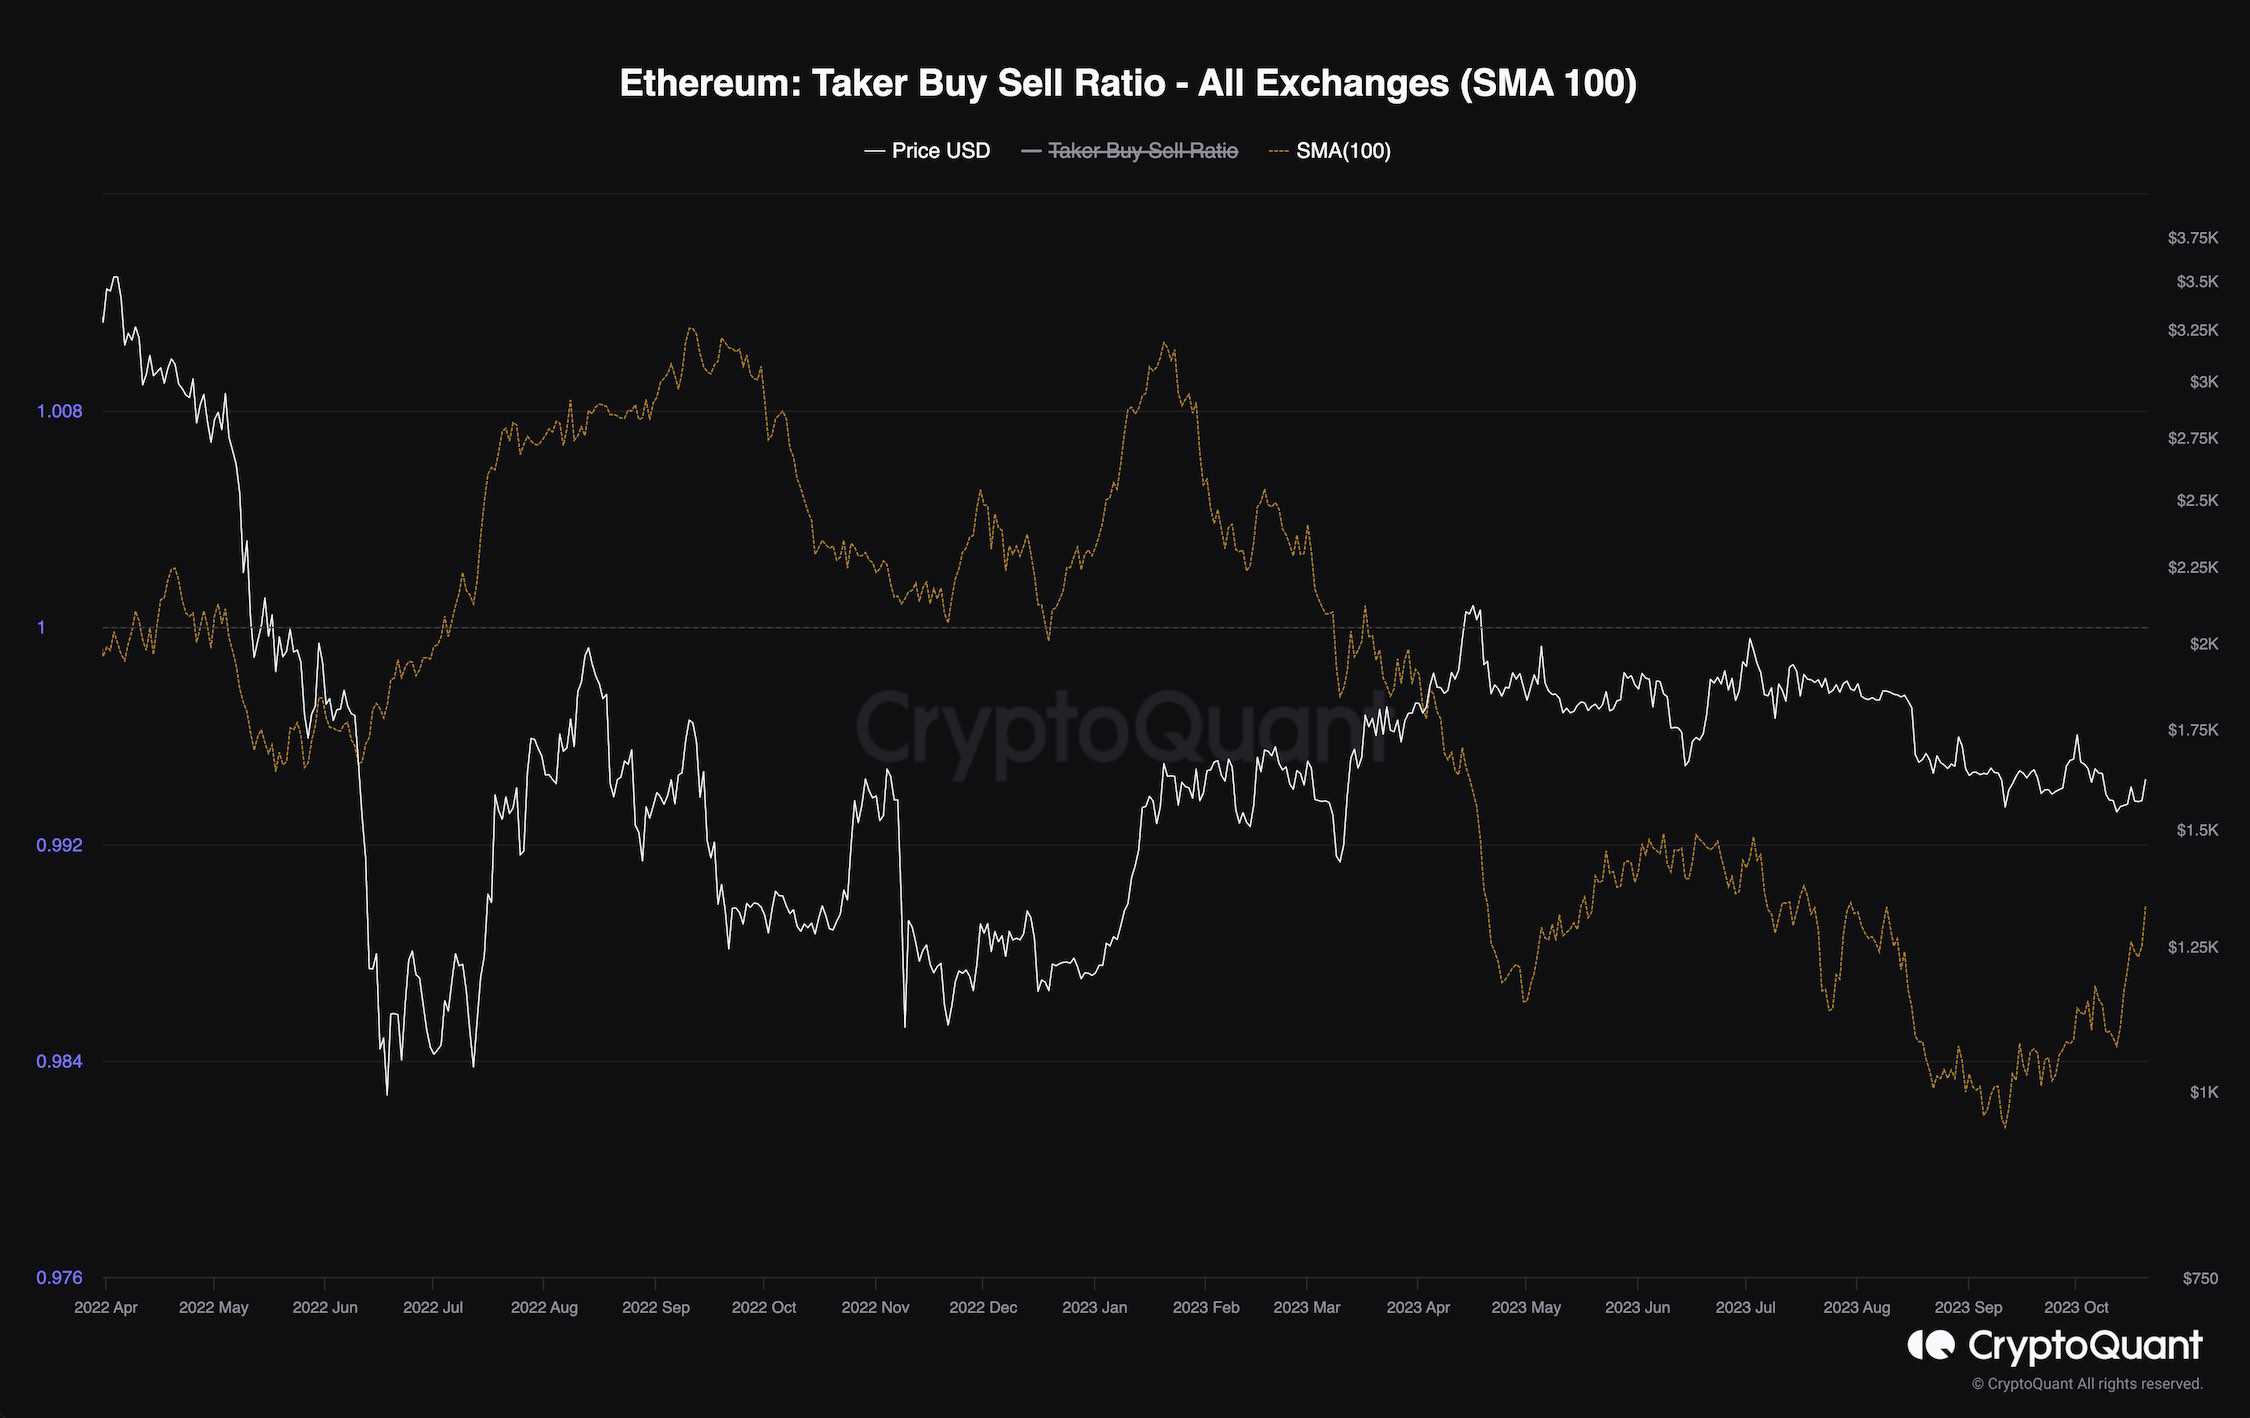
This chart depicts the 100-day moving average of the taker buy-sell ratio metric, one of the most valuable futures market sentiment indicators. Takers are orders executed aggressively at market price and are the ones that move the price. Taker buy-sell ratio values below 1 show bearish sentiment, while values above 1 are considered bullish.
As the chart demonstrates, this metric has risen recently but is still below 1. If this increase in the taker buy-sell ratio continues and the metric climbs above 1, a new price rally could be expected, and the market could finally break above the $2,000 resistance level. However, if the metric fails to break above 1, things are unlikely to change, and the price could drop further in the short term.
Binance Free $100 (Exclusive): Use this link to register and receive $100 free and 10% off fees on Binance Futures first month (terms).
PrimeXBT Special Offer: Use this link to register & enter CRYPTOPOTATO50 code to receive up to $7,000 on your deposits.
Disclaimer: Information found on CryptoPotato is those of writers quoted. It does not represent the opinions of CryptoPotato on whether to buy, sell, or hold any investments. You are advised to conduct your own research before making any investment decisions. Use provided information at your own risk. See Disclaimer for more information.
Cryptocurrency charts by TradingView.
[ad_2]
Source link