")
[ad_1]
Bitcoin’s price surprisingly spiked higher yesterday, closing above multiple significant resistance levels. However, the main obstacle, the $30K level, remains intact.
Technical Analysis
By Edris
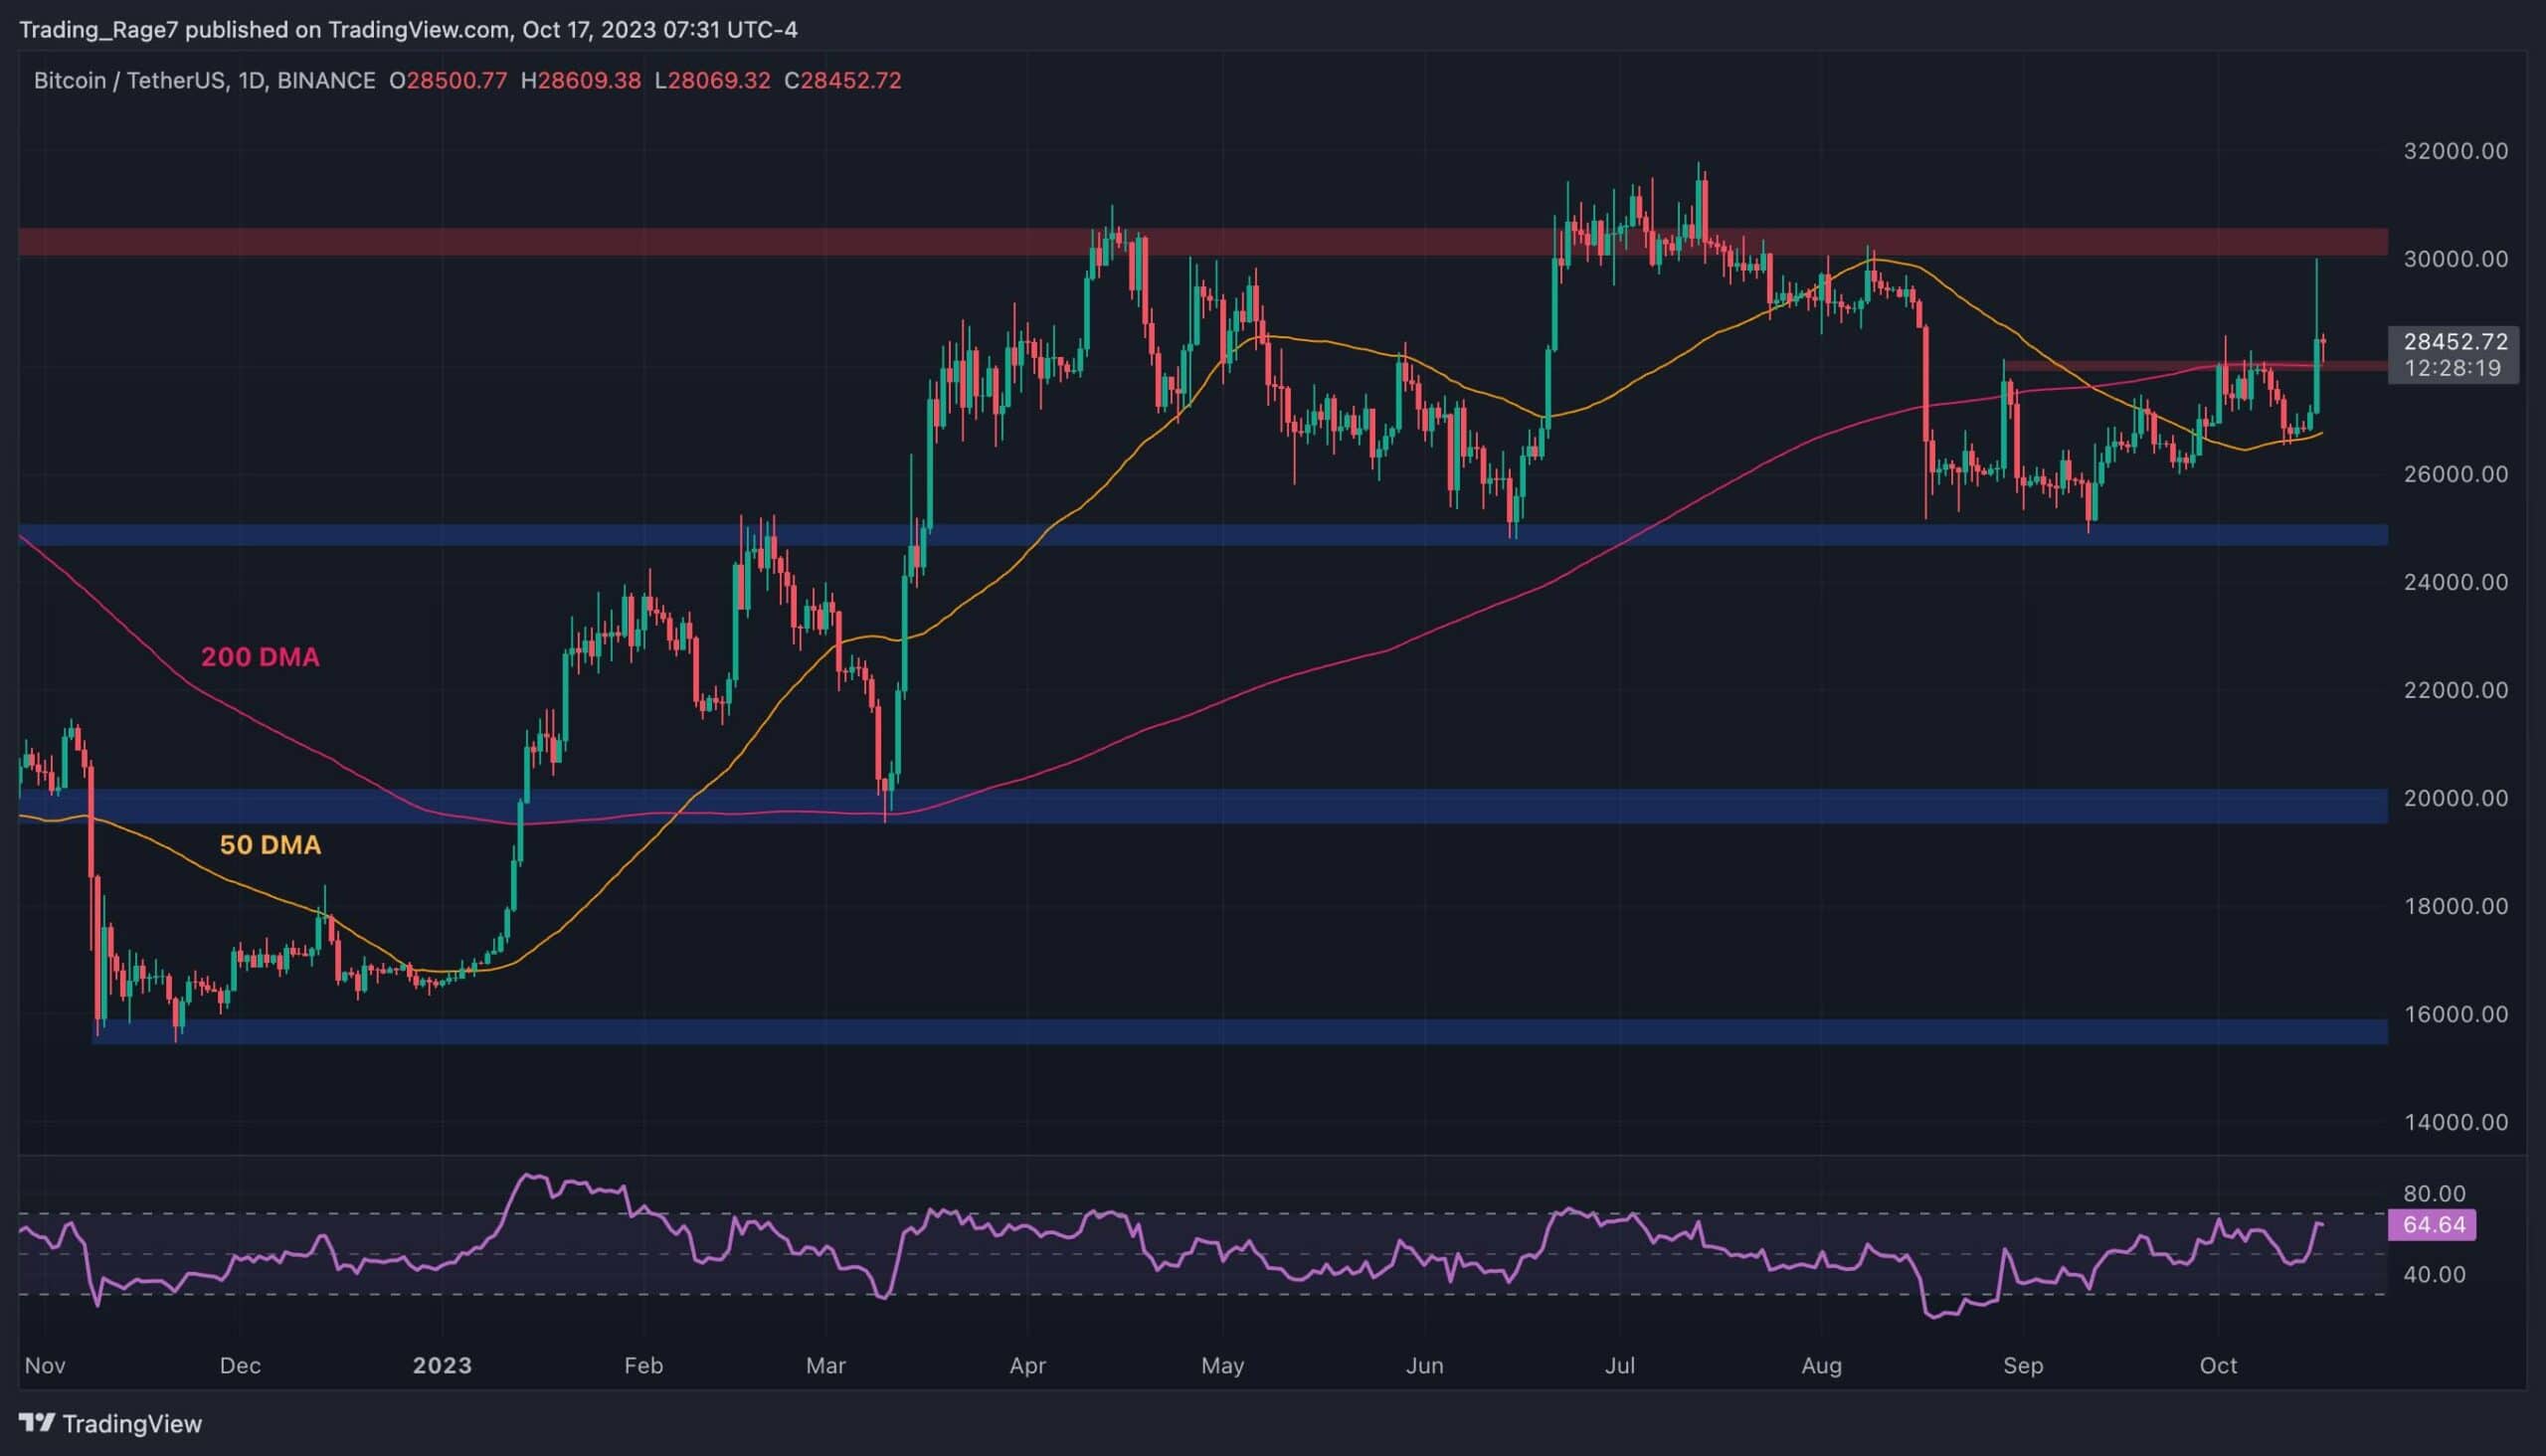
The Daily Chart
On the daily chart, the price has been supported by the 50-day moving average located around the $27K mark. It has rebounded from this level since, aggressively breaking above both the $28K resistance level and the 200-day moving average near the same area.
While yesterday’s daily candle closed above these levels, it still closed with a very large wick to the upside. For investors to be optimistic that the $30K resistance zone is finally about to be broken, today’s daily candle must hold above the 200-day moving average. Otherwise, the recent move will be another bull trap, and the price will likely crash afterward.
It’s also worth noting that yesterday’s move was caused by an outlier event of a false report of an approved spot Bitcoin ETF.
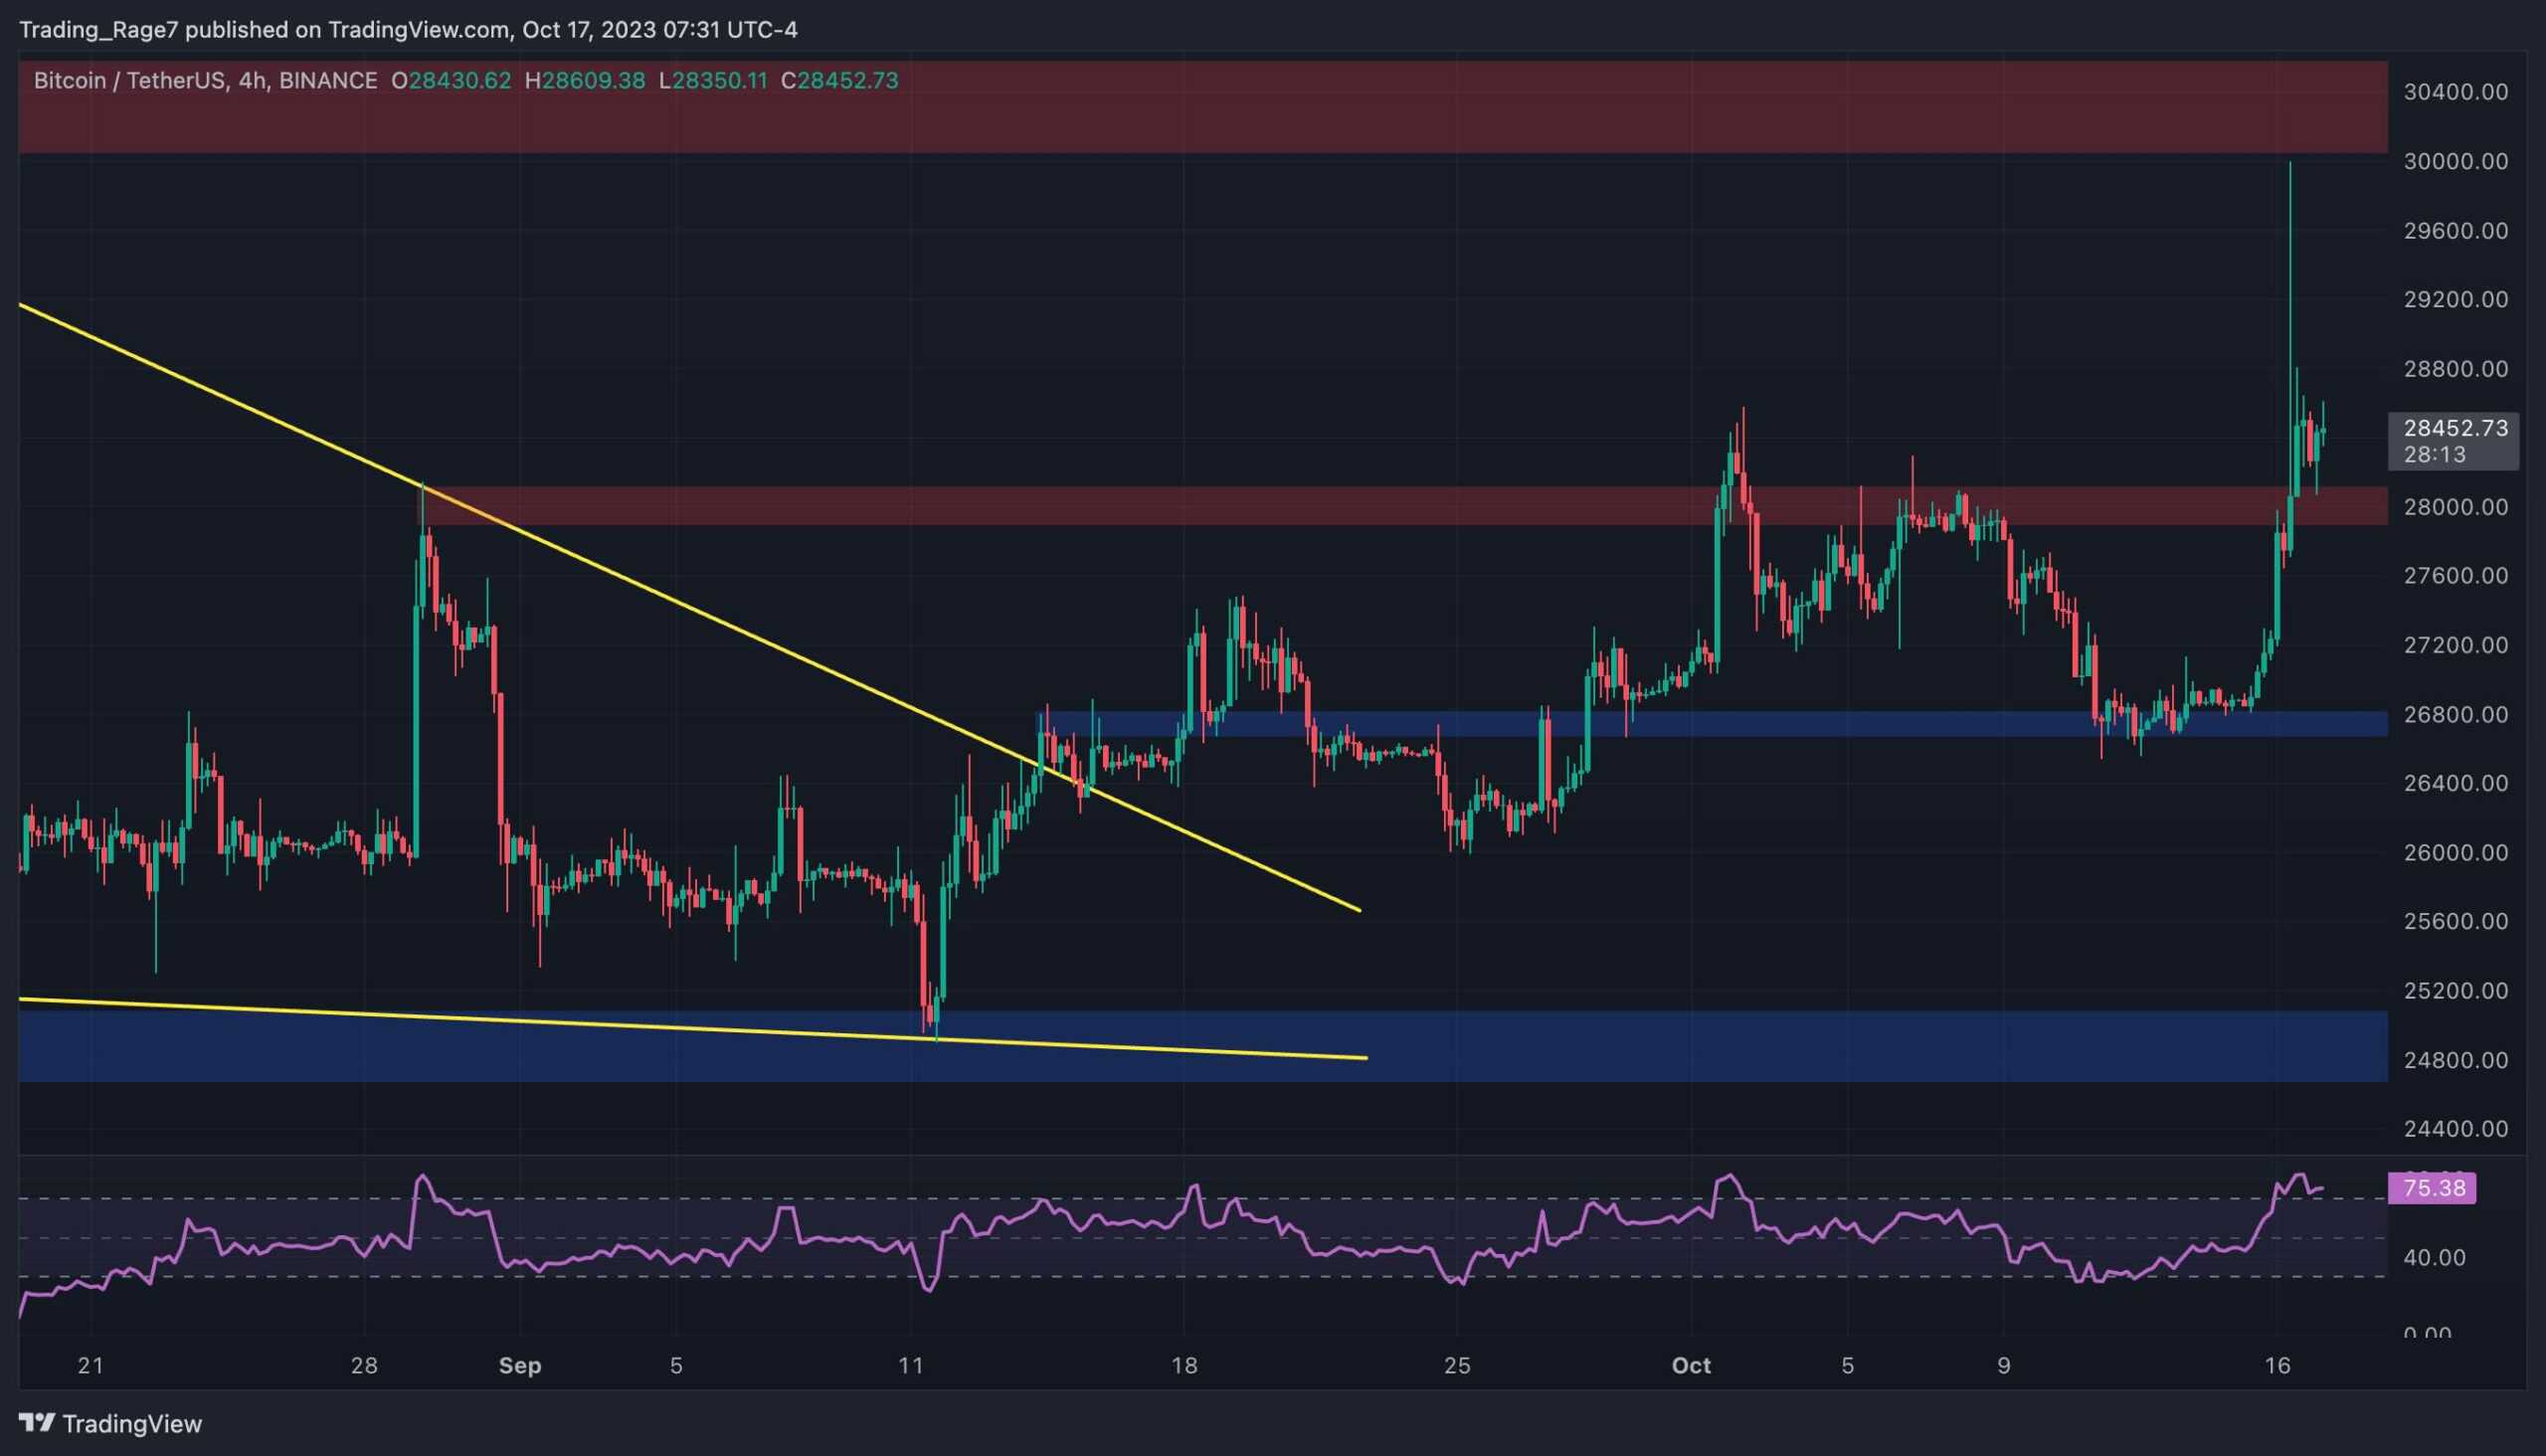
The 4-Hour Chart
The 4-hour chart shows that the price has broken through the $28K resistance level with some momentum, following a rebound from the $27K support zone. The market is currently retesting the broken $28K level and is holding above it. If the price does not fall back below this level, it would only be a matter of time before a rally toward the $30K resistance zone.
Meanwhile, the RSI indicator is showing a clear overbought signal, hinting at the probability of a fake breakout and a bearish reversal.
On-Chain Analysis
By Edris
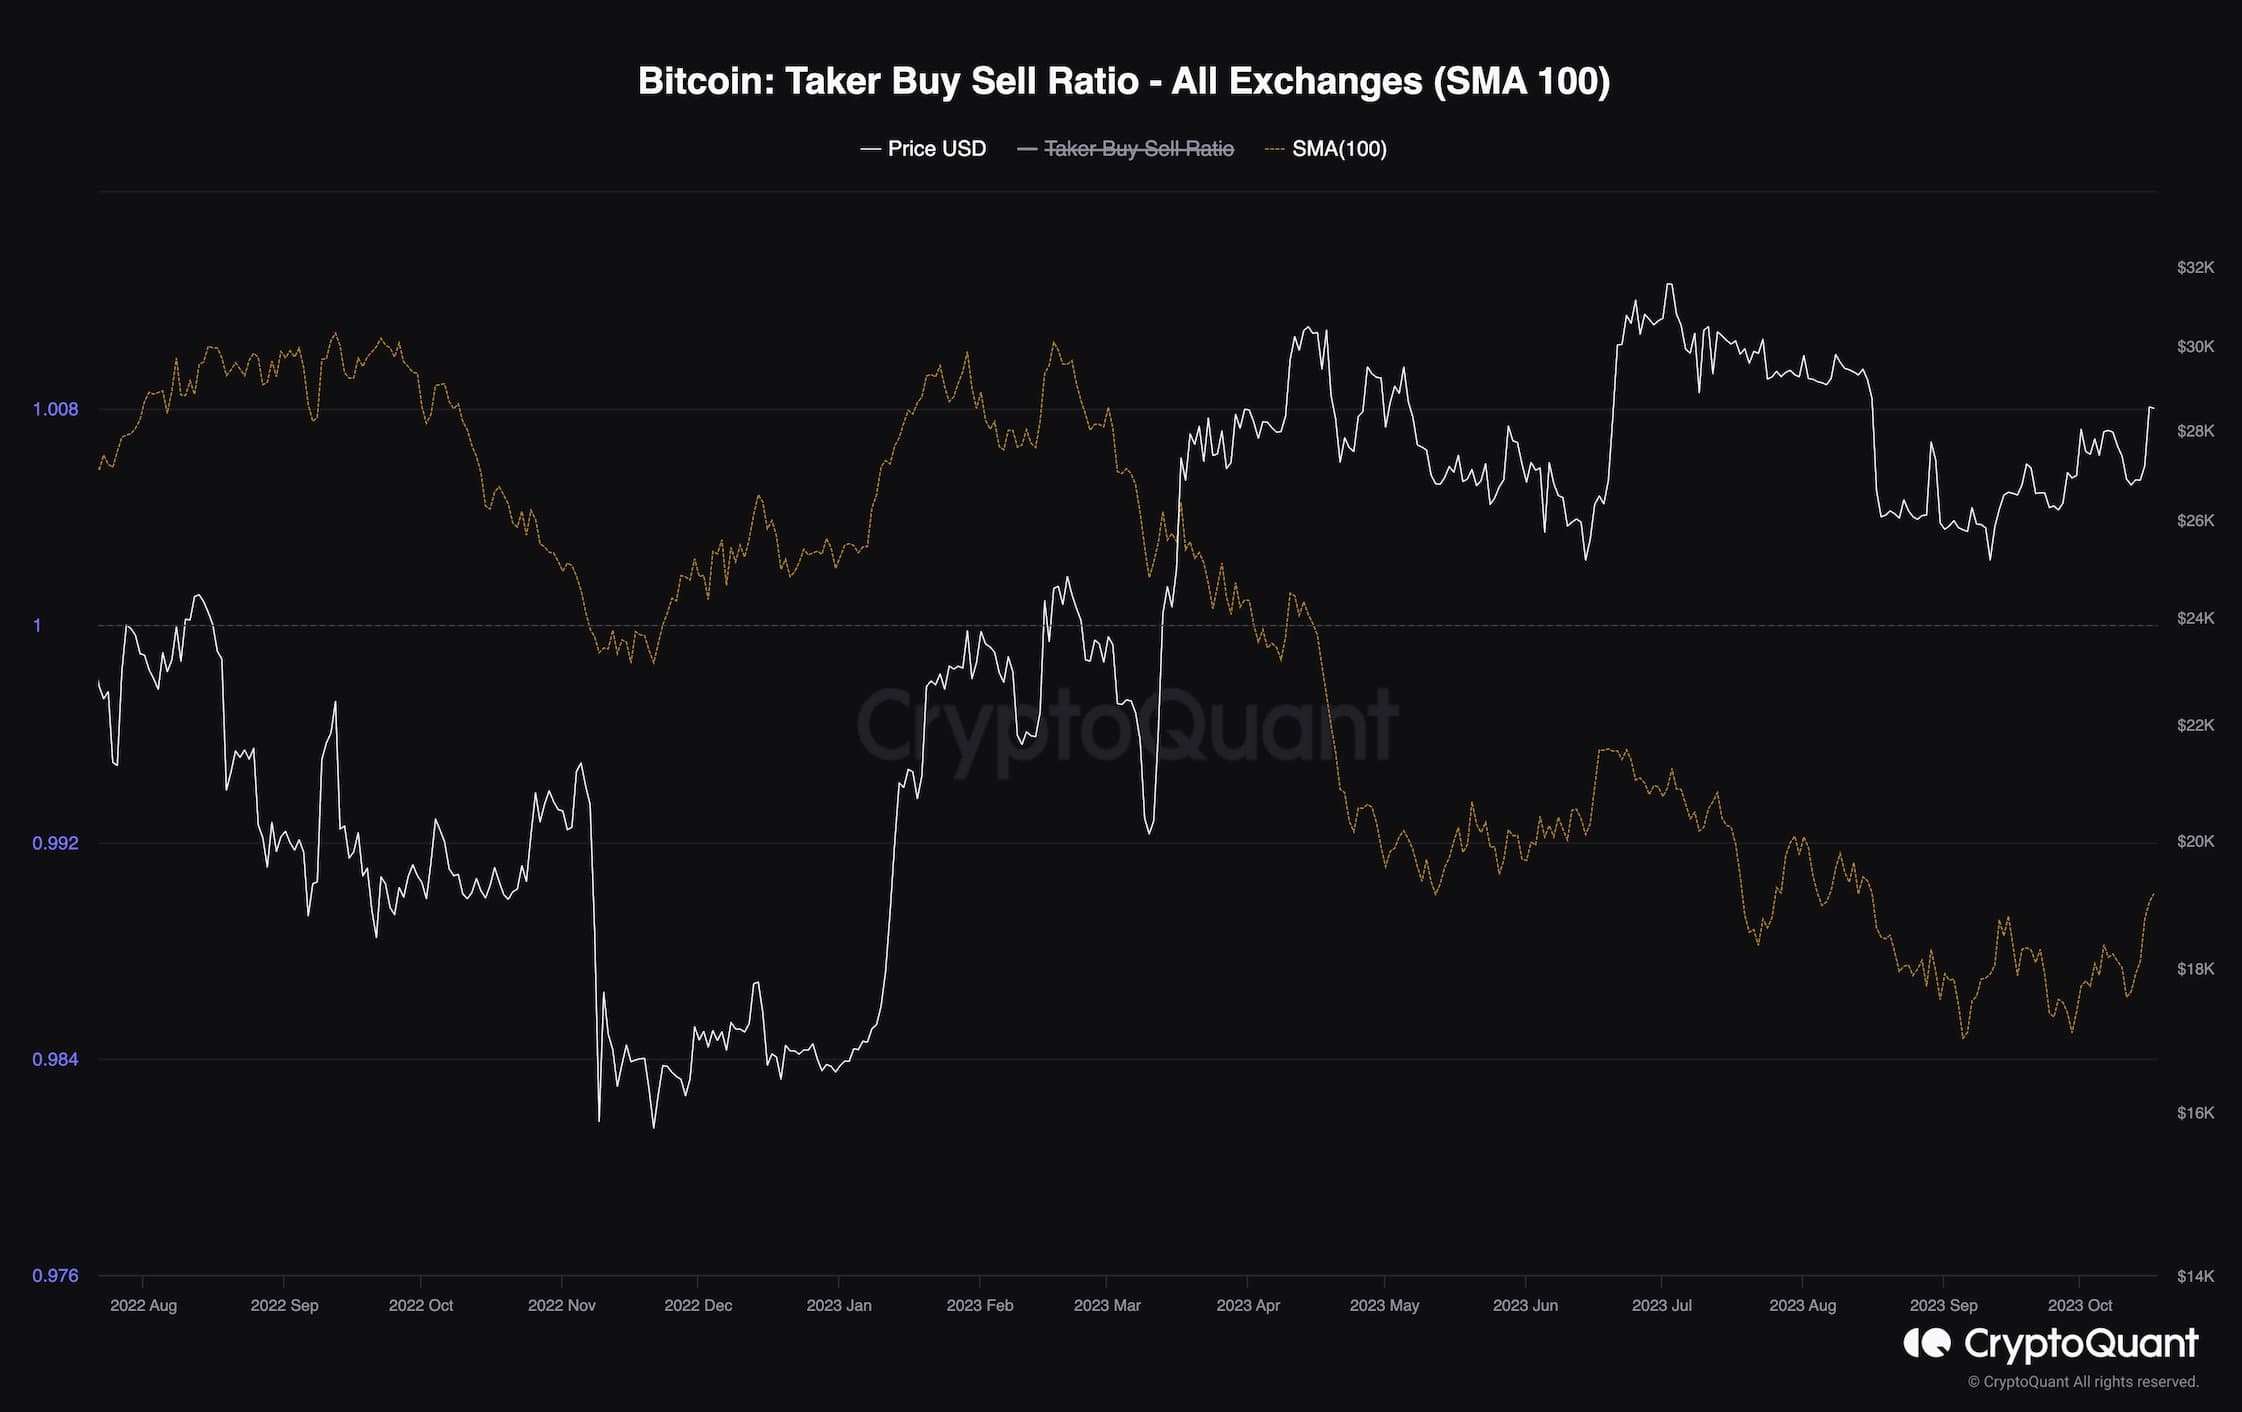
Bitcoin Taker Buy Sell Ratio
Bitcoin’s price suddenly spiked yesterday, approaching the key $30K resistance level once again.
This chart demonstrates the 100-day moving average of the taker buy-sell ratio metric. This metric measures whether buyers or sellers are executing their orders more aggressively. Values above 1 are considered bullish, while values below 1 are bearish.
It is evident that the taker buy-sell ratio metric has been trending below 1 for the last few months. However, with the recent surge in price, the metric is also rising higher. While still below 1, if this trend continues and the metric approaches 1 and eventually climbs higher, the market will likely enter a new bullish phase for the mid-term.
Binance Free $100 (Exclusive): Use this link to register and receive $100 free and 10% off fees on Binance Futures first month (terms).
PrimeXBT Special Offer: Use this link to register & enter CRYPTOPOTATO50 code to receive up to $7,000 on your deposits.
Disclaimer: Information found on CryptoPotato is those of writers quoted. It does not represent the opinions of CryptoPotato on whether to buy, sell, or hold any investments. You are advised to conduct your own research before making any investment decisions. Use provided information at your own risk. See Disclaimer for more information.
Cryptocurrency charts by TradingView.
[ad_2]
Source link